

Answered step by step
Verified Expert Solution
Question
1 Approved Answer
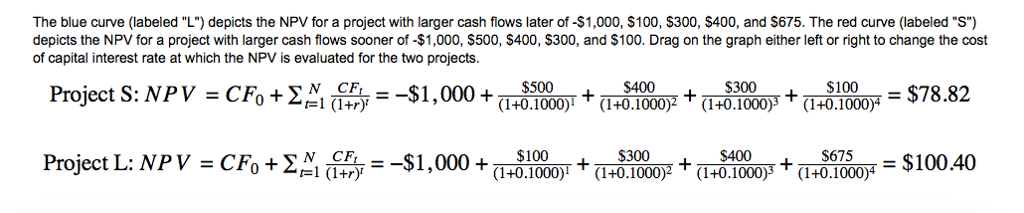
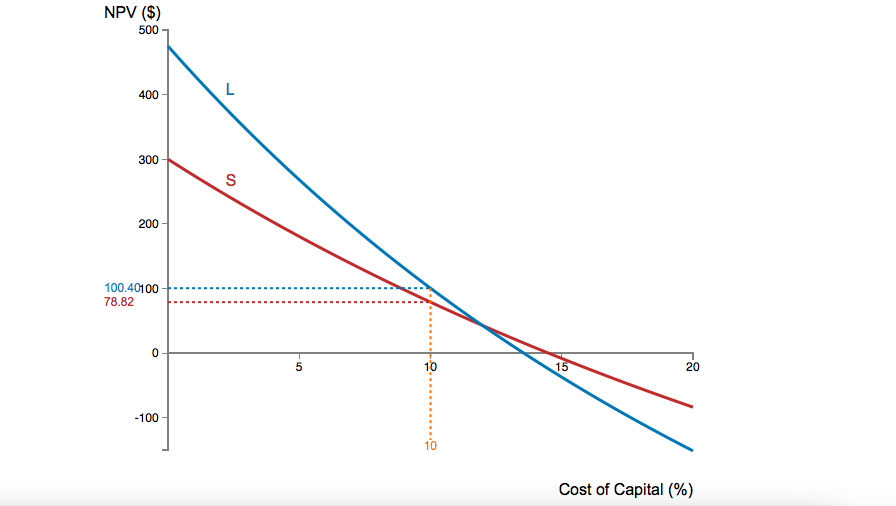
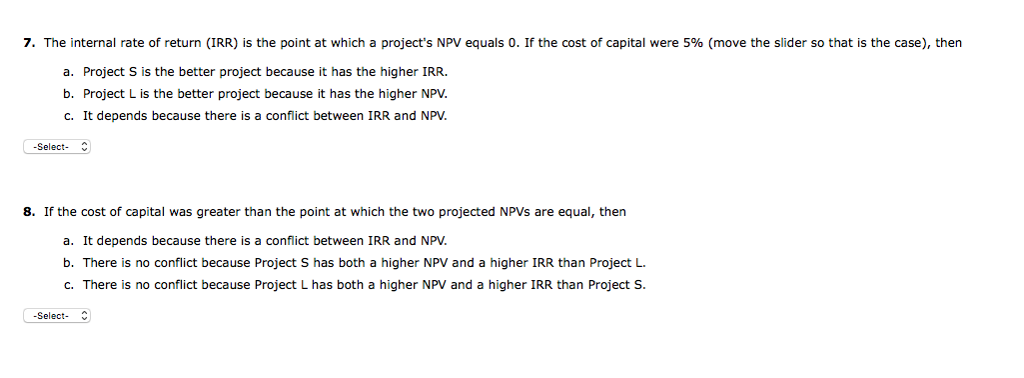
The blue curve (labeled L) depicts the NPV for a project with larger cash flows later of -$1,000, $100, $300, $400, and $675. The red
Step by Step Solution
There are 3 Steps involved in it
Step: 1

Get Instant Access to Expert-Tailored Solutions
See step-by-step solutions with expert insights and AI powered tools for academic success
Step: 2

Step: 3
Ace Your Homework with AI
Get the answers you need in no time with our AI-driven, step-by-step assistance
Get Started
Financial Institutions Management A Risk Management Approach
Authors: Anthony Saunders, Marcia Millon Cornett
9th edition
ISBN: 1259717771, 1259717772, 9781260048186, 1260048187, 978-1259717772