Answered step by step
Verified Expert Solution
Link Copied!

Question

1 Approved Answer

The blue curve on the following graph shows the height of an airplane over 10 minutes of flight. The two black lines are tangent to
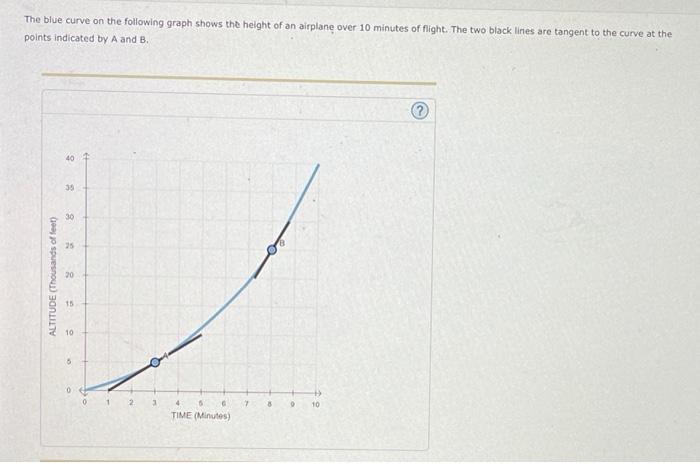
image text in transcribed
The blue curve on the following graph shows the height of an airplane over 10 minutes of flight. The two black lines are tangent to the curve at the points indicated by A and B. 401 39 30 25 ALTITUDE (Thousands of feet) 30 15 10 5 0 0 1 2 8 0 10 TIME (Minutes) The slope of the blue curve measures the plane's rate of ascent thousands of feet per minute The unit of measurement for the slope of the curve is At point A, the slope of the curve is which means that the plane is ascending Calculating the slope, pay extra attention to the units of analysis.) at a rate of feet per minute. (Hint At point B, the slope of the blue curve is which means that the plane is (Hint: Calculating the slope, pay extra attention to the units of analysis.) at a rate of feet per minute

Step by Step Solution

There are 3 Steps involved in it

Step: 1

blur-text-image

Get Instant Access to Expert-Tailored Solutions

See step-by-step solutions with expert insights and AI powered tools for academic success

Step: 2

blur-text-image_2

Step: 3

blur-text-image_3

Ace Your Homework with AI

Get the answers you need in no time with our AI-driven, step-by-step assistance

Get Started

Recommended Textbook for

Accounting

Authors: Carl s. warren, James m. reeve, Philip e. fess

21st Edition

978-0324400205, 324225016, 324188005, 324400209, 9780324225013, 978-0324188004

More Books

Students also viewed these Accounting questions

Question

How does HPLC differ from ion-exchange chromatography?

Answered: 1 week ago