

Answered step by step
Verified Expert Solution
Question
1 Approved Answer
the bottom balance sheet is the one to follow e c Assets Cash Accounts receivable, net Merchandise inventory Prepaid expenses Plant assets, net Total assets
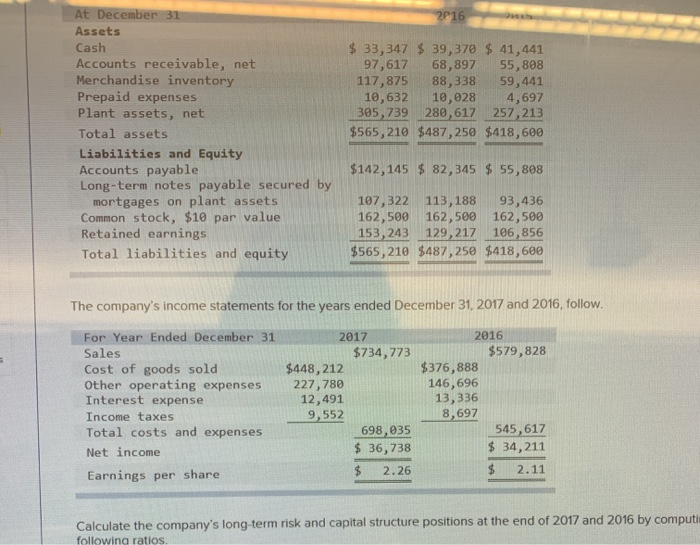
the bottom balance sheet is the one to follow
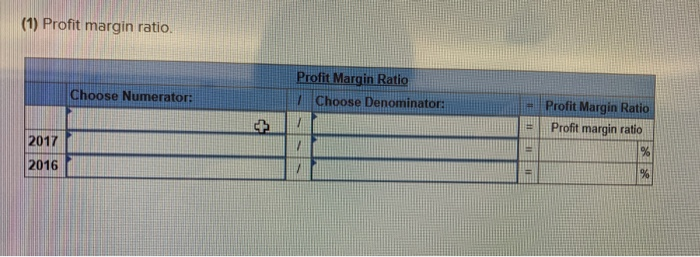
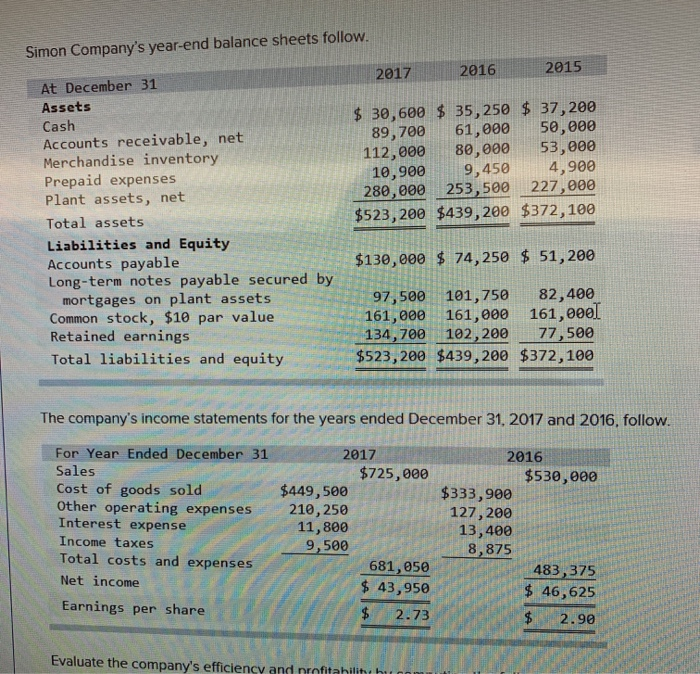
e c Assets Cash Accounts receivable, net Merchandise inventory Prepaid expenses Plant assets, net Total assets Liabilities and Equity Accounts payable Long-term notes payable secured by 33,347 $ 39,370 41,441 97,61768,897 55,808 117,875 88,338 59,441 10,63210,028 4,697 305,739 280,617 257,213 $565,210 $487,250 $418,600 $142,145 $ 82,345 $55,808 mortgages on plant assets Common stock, $10 par value Retained earnings Total liabilities and equity 107,322 113,188 93,436 162,500 162,500 162,580 153, 243 129,217 196, 856 $565,210 $487,250 $418,600 The company's income statements for the years ended December 31, 2017 and 2016, follow. For Year Ended December 31 20172, 376 96 2016 $579,828 $734, 773 Sales Cost of goods solod Other operating expenses Interest expense Income taxes Total costs and expenses Net income $376,888 146,696 13,336 8,697 $448,212 227,780 12,491 545,617 34,211 698,035 36,738 $ 2.26 Earnings per share Calculate the company's long-term risk and capital structure positions at the end of 2017 and 2016 by computis followina ratios (1) Profit margin ratio Profit Margin Ratio Profit Margin Ratio | Profit margin ratio Choose Denominator: Choose Numerator: 2017 2016 Simon Company's year-end balance sheets follow 20162015 2017 At December 31 Assets Cash Accounts receivable, net Merchandise inventory Prepaid expenses Plant assets, net Total assets Liabilities and Equity Accounts payable Long-term notes payable secured by 30,600 $ 35,250 37,200 89,700 61,000 50,000 112,000 80,000 53,00e 10,9009,450 4,900 280,000 253,500 227,000 $523,200 $439,200 $372,100 $130,000 74,250 51,200 97,500 101,750 82,400 161,000 161,000 161,0eel 134,700 102,20077,500 $523,200 $439,200 $372,100 mortgages on plant assets Common stock, $10 par value Retained earnings Total liabilities and equity The company's income statements for the years ended December 31, 2017 and 2016, follow. For Year Ended December 31 017 Sales Cost of goods sold Other operating expenses 210,25e Interest expense Income taxes Total costs and expenses Net income 2016 $725,000 $530,000 $449,500 $333,900 127,200 13,400 8,875 11,800 9,500 681,050 $ 43,950 $ 2.73 483,375 46,625 $2.90 Earnings per share Evaluate the company's efficiency and nrofitahilitt h Step by Step Solution
There are 3 Steps involved in it
Step: 1

Get Instant Access to Expert-Tailored Solutions
See step-by-step solutions with expert insights and AI powered tools for academic success
Step: 2

Step: 3
Ace Your Homework with AI
Get the answers you need in no time with our AI-driven, step-by-step assistance
Get Started
Audit And Accounting Guide State And Local Governments
Authors: AICPA
1st Edition
1945498587, 978-1945498589