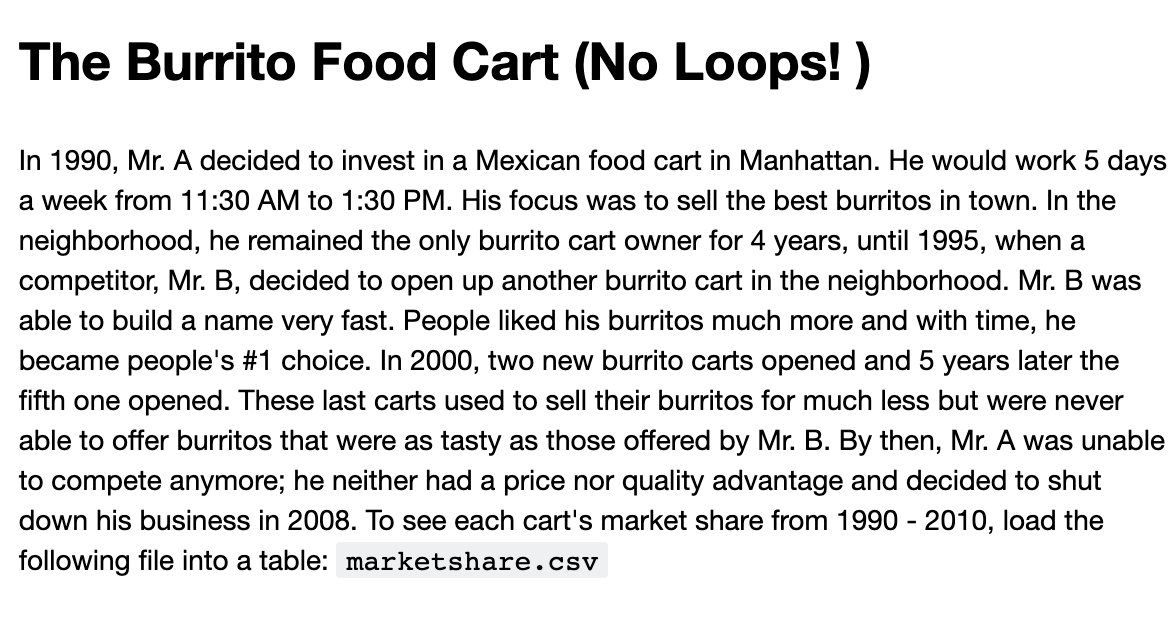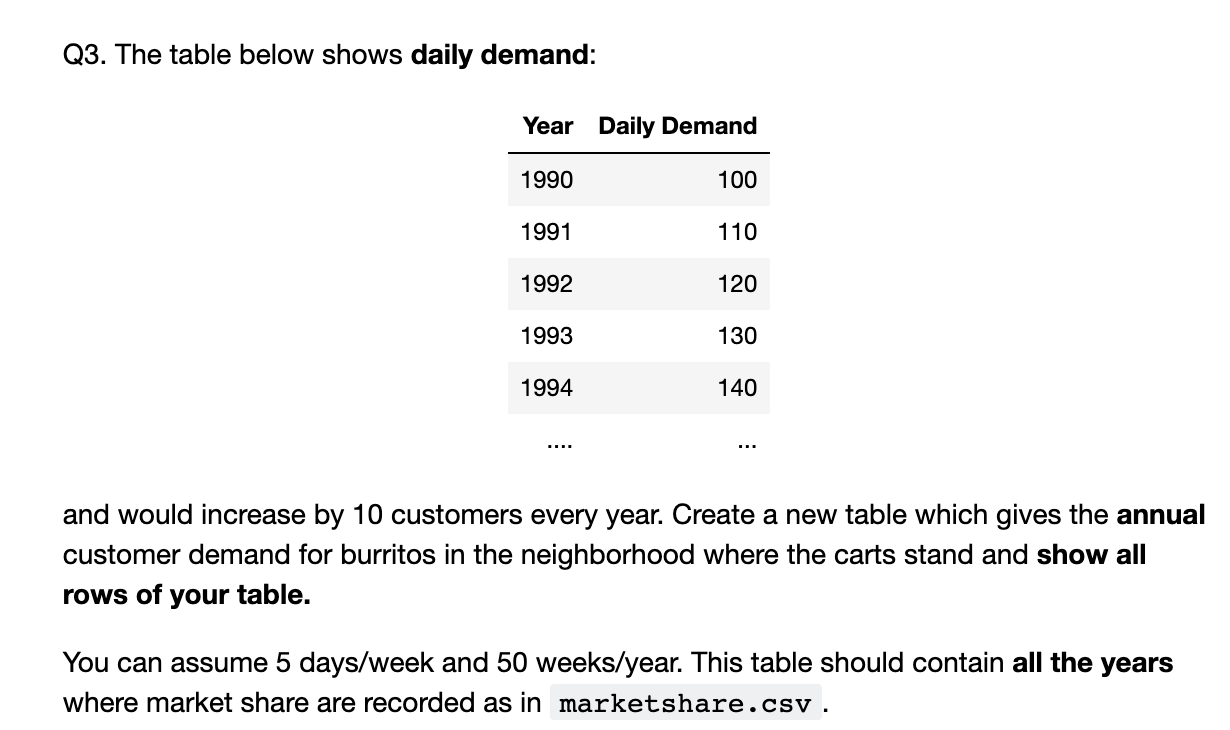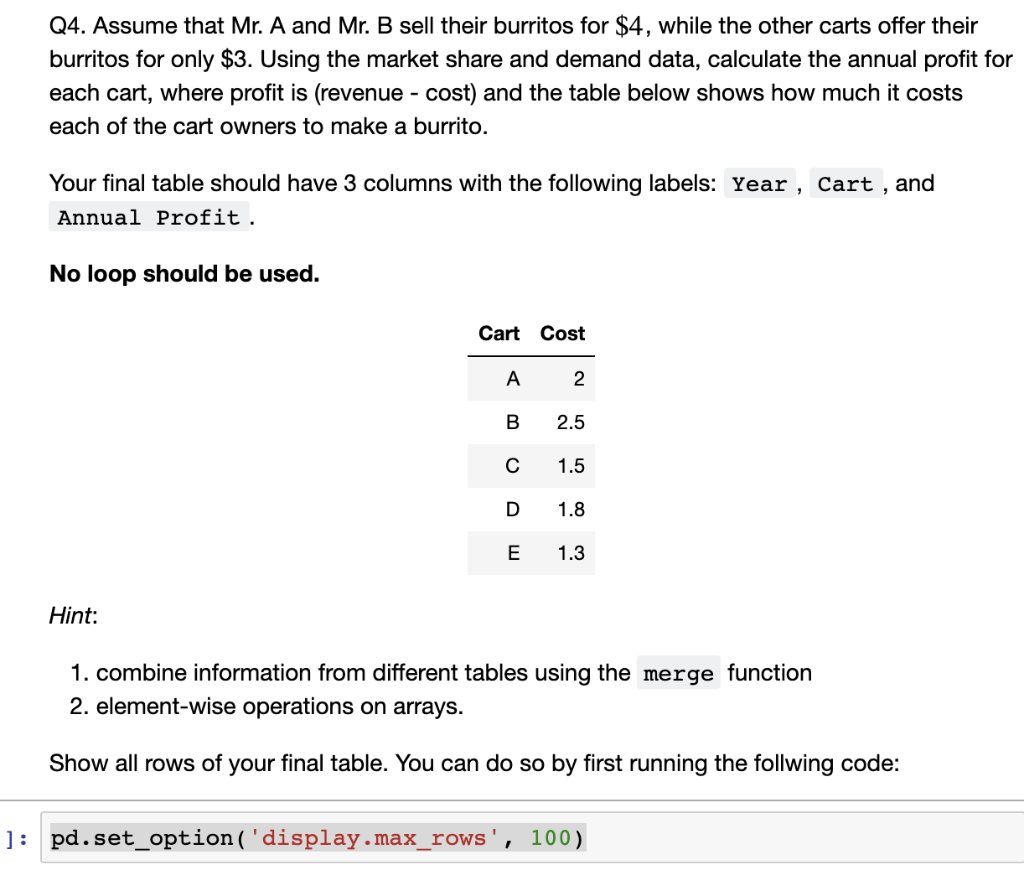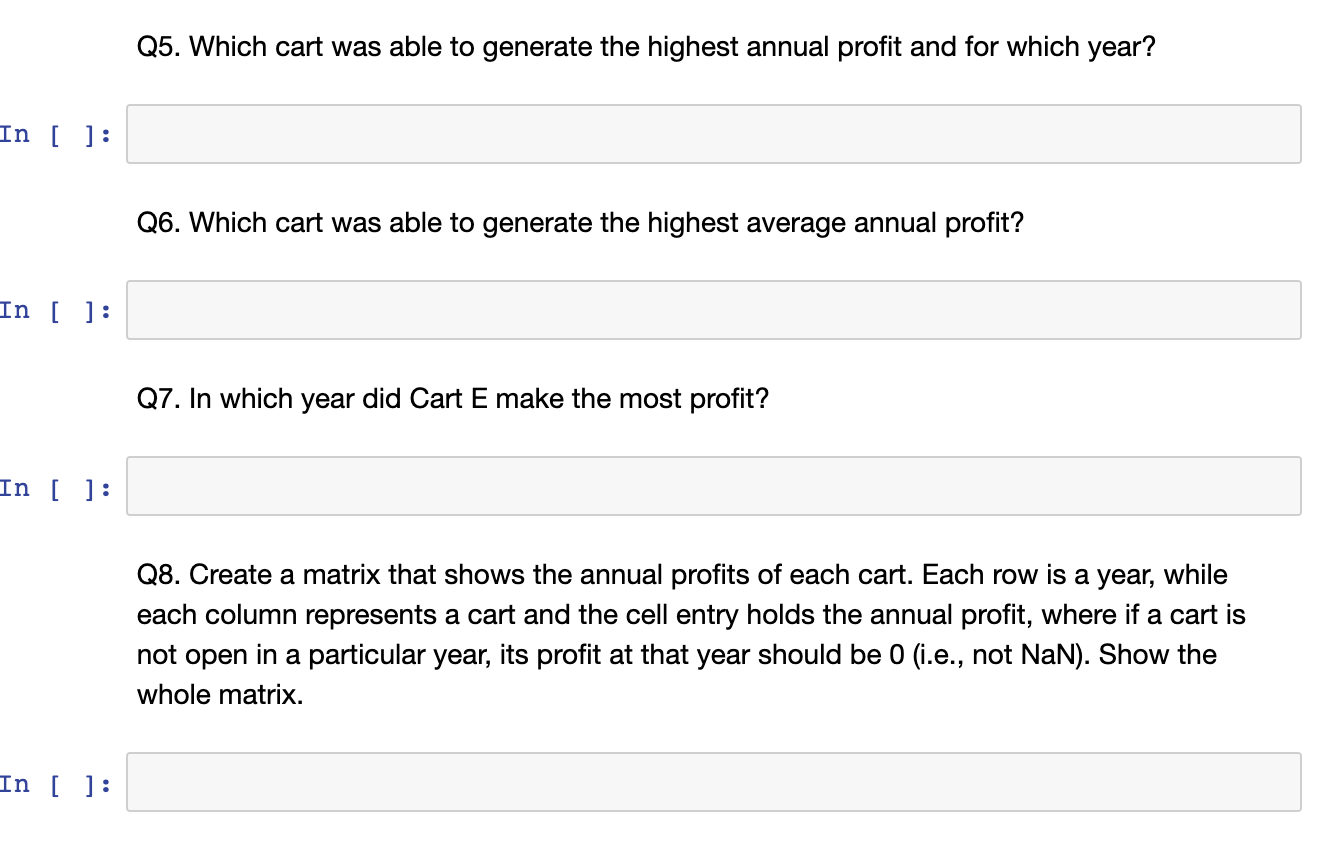


The Burrito Food Cart (No Loops!) In 1990, Mr. A decided to invest in a Mexican food cart in Manhattan. He would work 5 days a week from 11:30 AM to 1:30 PM. His focus was to sell the best burritos in town. In the neighborhood, he remained the only burrito cart owner for 4 years, until 1995, when a competitor, Mr. B, decided to open up another burrito cart in the neighborhood. Mr. B was able to build a name very fast. People liked his burritos much more and with time, he became people's #1 choice. In 2000, two new burrito carts opened and 5 years later the fifth one opened. These last carts used to sell their burritos for much less but were never able to offer burritos that were as tasty as those offered by Mr. B. By then, Mr. A was unable to compete anymore; he neither had a price nor quality advantage and decided to shut down his business in 2008. To see each cart's market share from 1990 - 2010, load the following file into a table: marketshare.csv Q2. Verify that every year, the total market share of all opened carts for that year adds up to 1. Q3. The table below shows daily demand: Year Daily Demand 1990 100 1991 110 1992 120 1993 130 1994 140 and would increase by 10 customers every year. Create a new table which gives the annual customer demand for burritos in the neighborhood where the carts stand and show all rows of your table. You can assume 5 days/week and 50 weeks/year. This table should contain all the years where market share are recorded as in marketshare.csv. Q4. Assume that Mr. A and Mr. B sell their burritos for $4, while the other carts offer their burritos for only $3. Using the market share and demand data, calculate the annual profit for each cart, where profit is (revenue - cost) and the table below shows how much it costs each of the cart owners to make a burrito. Your final table should have 3 columns with the following labels: Year , Cart , and Annual Profit. No loop should be used. Cart Cost A 2 B 2.5 1.5 1.8 E 1.3 Hint: 1. combine information from different tables using the merge function 2. element-wise operations on arrays. Show all rows of your final table. You can do so by first running the follwing code: ]: pd.set_option('display.max_rows', 100) Q5. Which cart was able to generate the highest annual profit and for which year? In [ ]: Q6. Which cart was able to generate the highest average annual profit? In [ ]: Q7. In which year did Cart E make the most profit? In [ ]: Q8. Create a matrix that shows the annual profits of each cart. Each row is a year, while each column represents a cart and the cell entry holds the annual profit, where if a cart is not open in a particular year, its profit at that year should be 0 (i.e., not NaN). Show the whole matrix. In [ ]: The Burrito Food Cart (No Loops!) In 1990, Mr. A decided to invest in a Mexican food cart in Manhattan. He would work 5 days a week from 11:30 AM to 1:30 PM. His focus was to sell the best burritos in town. In the neighborhood, he remained the only burrito cart owner for 4 years, until 1995, when a competitor, Mr. B, decided to open up another burrito cart in the neighborhood. Mr. B was able to build a name very fast. People liked his burritos much more and with time, he became people's #1 choice. In 2000, two new burrito carts opened and 5 years later the fifth one opened. These last carts used to sell their burritos for much less but were never able to offer burritos that were as tasty as those offered by Mr. B. By then, Mr. A was unable to compete anymore; he neither had a price nor quality advantage and decided to shut down his business in 2008. To see each cart's market share from 1990 - 2010, load the following file into a table: marketshare.csv Q2. Verify that every year, the total market share of all opened carts for that year adds up to 1. Q3. The table below shows daily demand: Year Daily Demand 1990 100 1991 110 1992 120 1993 130 1994 140 and would increase by 10 customers every year. Create a new table which gives the annual customer demand for burritos in the neighborhood where the carts stand and show all rows of your table. You can assume 5 days/week and 50 weeks/year. This table should contain all the years where market share are recorded as in marketshare.csv. Q4. Assume that Mr. A and Mr. B sell their burritos for $4, while the other carts offer their burritos for only $3. Using the market share and demand data, calculate the annual profit for each cart, where profit is (revenue - cost) and the table below shows how much it costs each of the cart owners to make a burrito. Your final table should have 3 columns with the following labels: Year , Cart , and Annual Profit. No loop should be used. Cart Cost A 2 B 2.5 1.5 1.8 E 1.3 Hint: 1. combine information from different tables using the merge function 2. element-wise operations on arrays. Show all rows of your final table. You can do so by first running the follwing code: ]: pd.set_option('display.max_rows', 100) Q5. Which cart was able to generate the highest annual profit and for which year? In [ ]: Q6. Which cart was able to generate the highest average annual profit? In [ ]: Q7. In which year did Cart E make the most profit? In [ ]: Q8. Create a matrix that shows the annual profits of each cart. Each row is a year, while each column represents a cart and the cell entry holds the annual profit, where if a cart is not open in a particular year, its profit at that year should be 0 (i.e., not NaN). Show the whole matrix. In [ ]


