Answered step by step
Verified Expert Solution
Question
1 Approved Answer
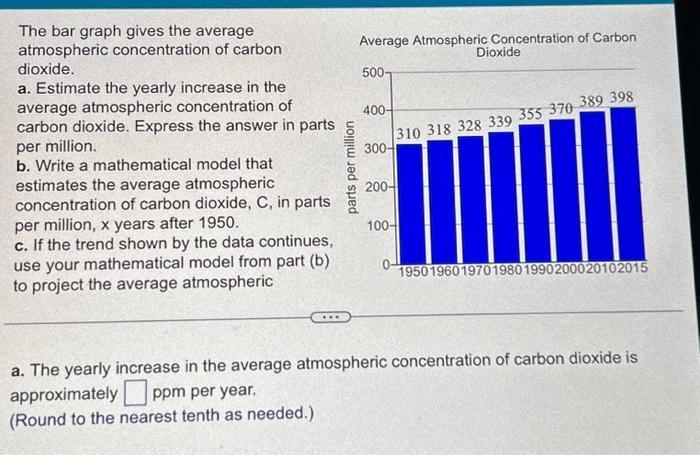
The bar graph gives the average atmospheric concentration of carbon dioxide. a. Estimate the yearly increase in the average atmospheric concentration of carbon dioxide.

The bar graph gives the average atmospheric concentration of carbon dioxide. a. Estimate the yearly increase in the average atmospheric concentration of carbon dioxide. Express the answer in parts per million. b. Write a mathematical model that estimates the average atmospheric concentration of carbon dioxide, C, in parts per million, x years after 1950. c. If the trend shown by the data continues, use your mathematical model from part (b) to project the average atmospheric parts per million Average Atmospheric Concentration of Carbon 500- 400- 300- 310 318 328 339 355 370 389 398 200- Dioxide 100- 19501960197019801990200020102015 a. The yearly increase in the average atmospheric concentration of carbon dioxide is approximately ppm per year. (Round to the nearest tenth as needed.)
Step by Step Solution
There are 3 Steps involved in it
Step: 1

Get Instant Access to Expert-Tailored Solutions
See step-by-step solutions with expert insights and AI powered tools for academic success
Step: 2

Step: 3

Ace Your Homework with AI
Get the answers you need in no time with our AI-driven, step-by-step assistance
Get Started


