

Question
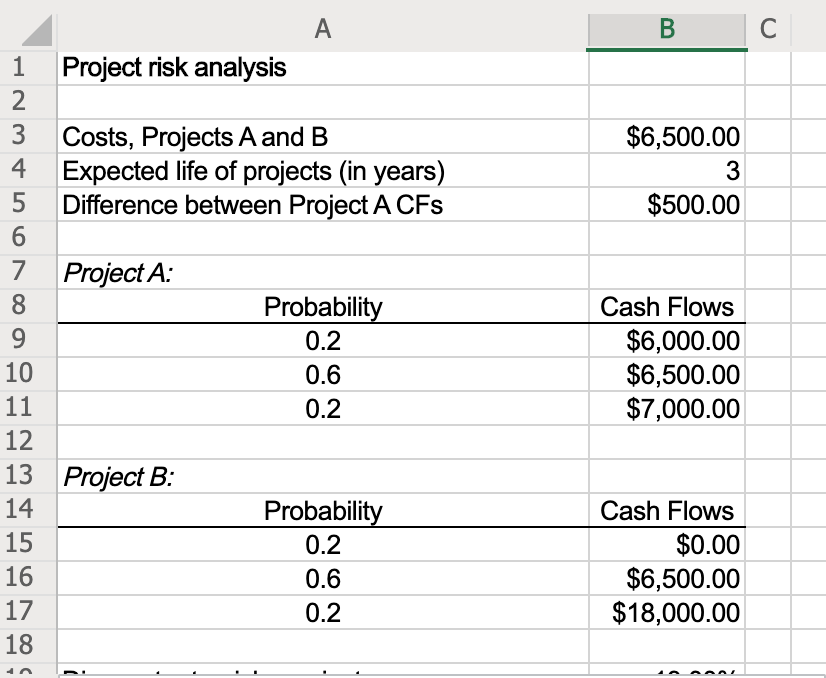
The Butler-Perkins Company (BPC) must decide between two mutually exclusive projects. Each costs $6,500 and has an expected life of 3 years. Annual project cash
The Butler-Perkins Company (BPC) must decide between two mutually exclusive projects. Each costs $6,500 and has an expected life of 3 years. Annual project cash flows begin 1 year after the initial investment and are subject to the following probability distributions:
| Project A | Project B | |||
| Probability | Cash Flows | Probability | Cash Flows | |
| 0.2 | $6,000 | 0.2 | $0 | |
| 0.6 | $6,500 | 0.6 | $6,500 | |
| 0.2 | $7,000 | 0.2 | $18,000 | |
BPC has decided to evaluate the riskier project at 13% and the less-risky project at 8%. The data has been collected in the Microsoft Excel Online file below. Open the spreadsheet and perform the required analysis to answer the questions below.
Open spreadsheet
-
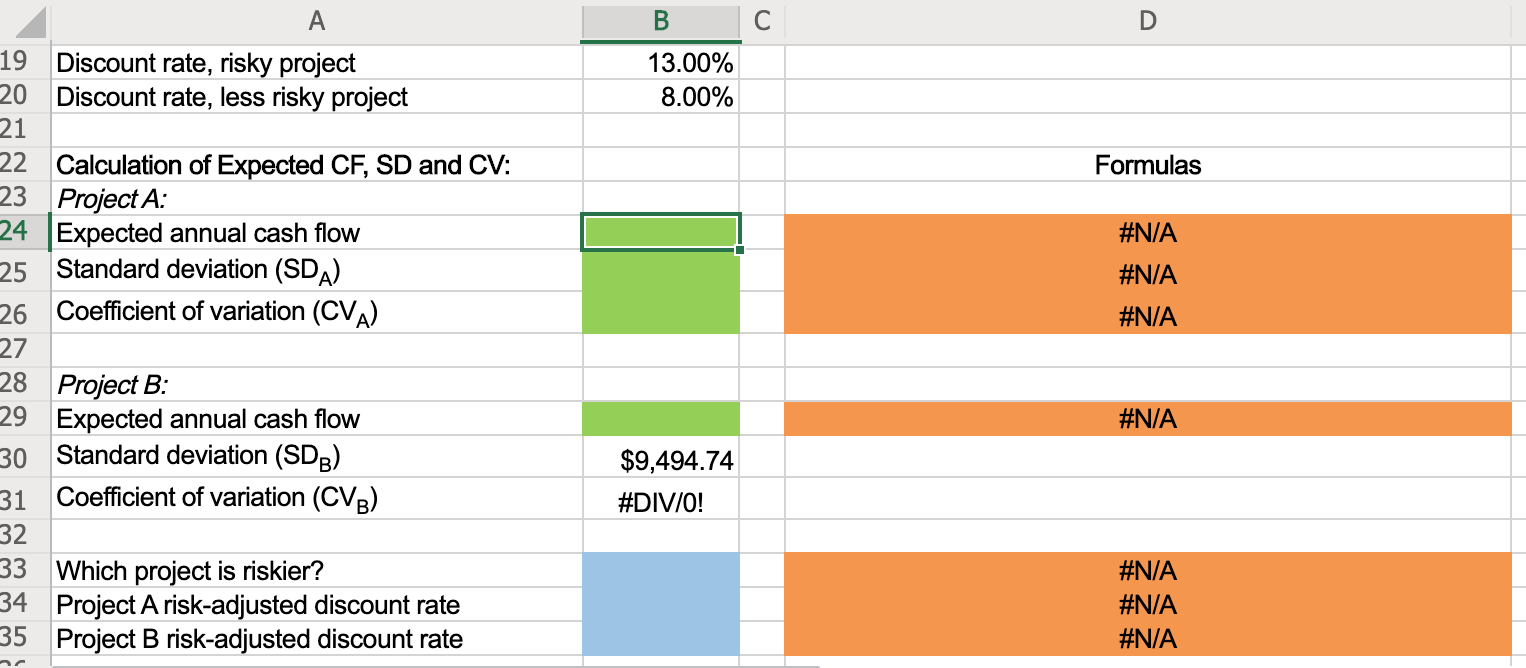
What is each project's expected annual cash flow? Round your answers to two decimal places.
Project A: $
Project B: $
-
Project B's standard deviation (B) is $5,822.37 and its coefficient of variation (CVB) is 0.78. What are the values of (A) and (CVA)? Round your answers to two decimal places.
-
A = $
CVA =
-
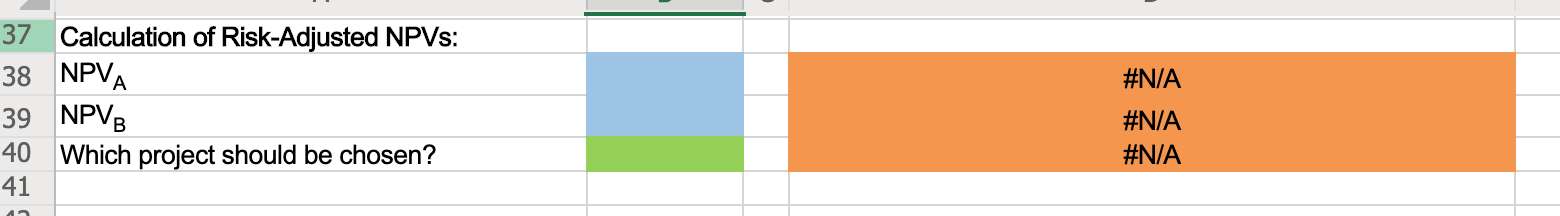
Based on the risk-adjusted NPVs, which project should BPC choose?
_________Project AProject B
-
If you knew that Project B's cash flows were negatively correlated with the firm's other cash flow, but Project A's cash flows were positively correlated, how might this affect the decision?
_________This would make Project B more appealing.This would make Project B less appealing.
If Project B's cash flows were negatively correlated with gross domestic product (GDP), while A's cash flows were positively correlated, would that influence your risk assessment?
_________This would make Project B more appealing.This would make Project B less appealing.
Step by Step Solution
There are 3 Steps involved in it
Step: 1

Get Instant Access to Expert-Tailored Solutions
See step-by-step solutions with expert insights and AI powered tools for academic success
Step: 2

Step: 3
Ace Your Homework with AI
Get the answers you need in no time with our AI-driven, step-by-step assistance
Get Started
Small Brewery Finance
Authors: Maria Pearman
1st Edition
1938469526, 978-1938469527