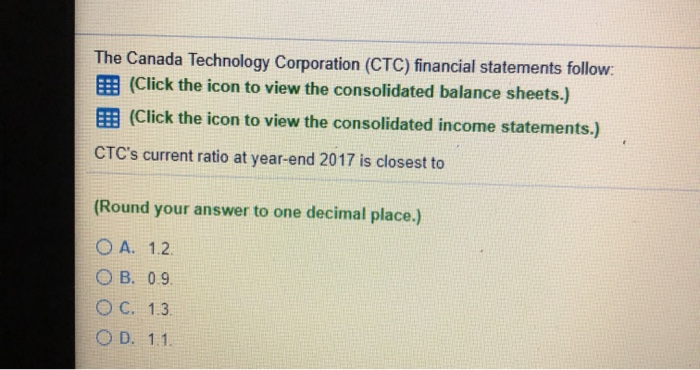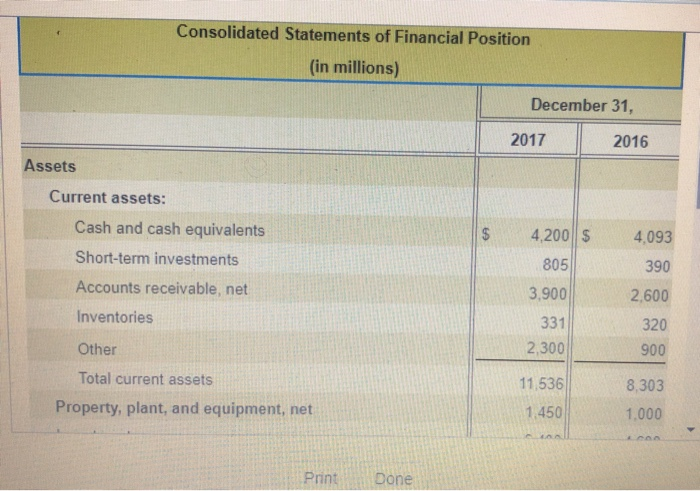
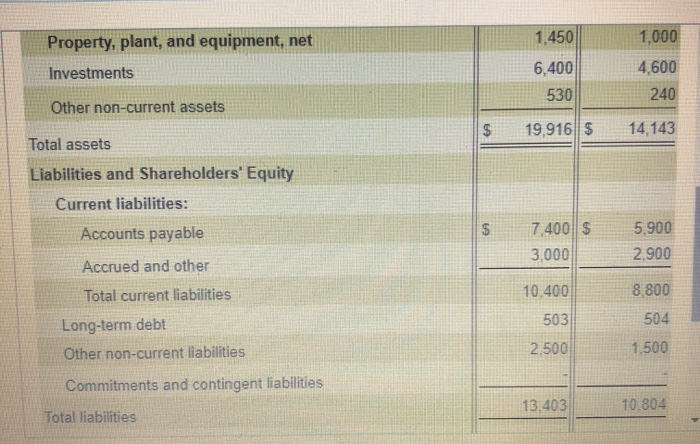
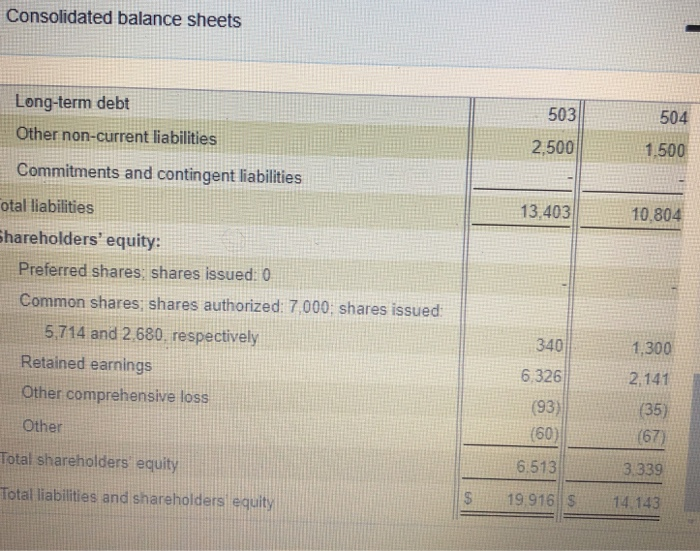
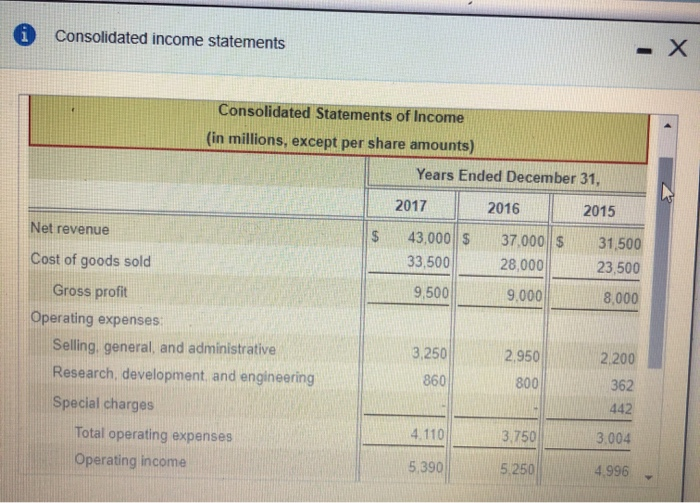
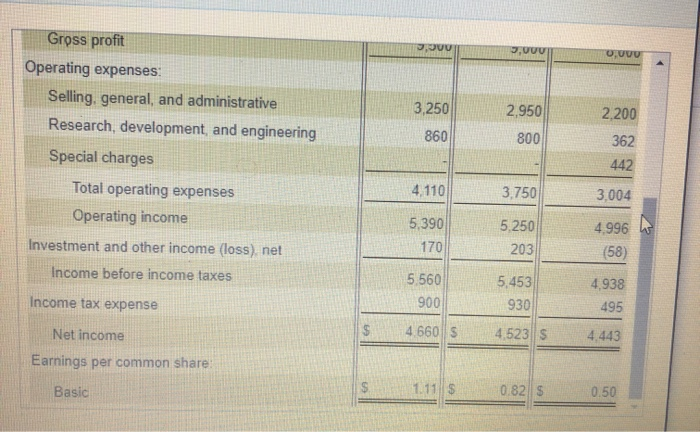
The Canada Technology Corporation (CTC) financial statements follow: (Click the icon to view the consolidated balance sheets.) E (Click the icon to view the consolidated income statements.) CTC's current ratio at year-end 2017 is closest to (Round your answer to one decimal place.) O A. 1.2 OB. 0.9 O C. 1.3. OD. 1.1. Consolidated Statements of Financial Position (in millions) December 31, 2017 2016 Assets Current assets: $ 4,200 $ 4,093 Cash and cash equivalents Short-term investments Accounts receivable, net 805 390 3.900 2,600 Inventories 331 320 900 Other 2.300 11,536 8,303 Total current assets Property, plant, and equipment, net 1.450 1.000 Print Done 1,450 1,000 Property, plant, and equipment, net Investments 4,600 6,400 530 240 Other non-current assets $ 19,916||$ 14,143 Total assets Liabilities and Shareholders' Equity Current liabilities: Accounts payable $ 7,400||$ 3,000 5.900 2.900 Accrued and other 10.400 8,800 503 504 Total current liabilities Long-term debt Other non-current liabilities Commitments and contingent liabilities 2.500 1.500 13,403 10.804 Total liabilities Consolidated balance sheets Long-term debt Other non-current liabilities 503 504 2,500 1.500 Commitments and contingent liabilities 13.403 10.804 otal liabilities Shareholders' equity: Preferred shares shares issued: 0 Common shares shares authorized: 7000, shares issued 5,714 and 2.680, respectively Retained earnings Other comprehensive loss 340 1,300 6.326 2.141 Other (93) (60) (35) (67) Total shareholders equity 6.513 3.339 Total liabilities and shareholders equity $ 19 916S 14.143 i Consolidated income statements - X Consolidated Statements of Income (in millions, except per share amounts) Years Ended December 31, 2017 2016 2015 Net revenue $ 43,000 $ 33,500 37.000||$ 28,000 31,500 23,500 9,500 9.000 8,000 Cost of goods sold Gross profit Operating expenses Selling general, and administrative Research, development and engineering Special charges Total operating expenses Operating income 3,250 2,950 2,200 860 800 362 442 4.110 3.750 3.004 5,390 5.250 4.996 Vio VUU UUUU 3,250 2.950 2,200 860 800 Gross profit Operating expenses: Selling, general, and administrative Research, development, and engineering Special charges Total operating expenses Operating income Investment and other income (loss), net Income before income taxes 362 442 4.110 3,750 3,004 5,390 170 5.250 203 4.996 W (58) 5.560 900 5,453 930 Income tax expense 4,938 495 Net income 46605 4,523s 4.443 Earnings per common share: s Basic 1.11$ 0.82 $ 0.50
