

Question
The Case Problem is listed below which will include the question as well as the answer. From the given question and answer the student will
The Case Problem is listed below which will include the question as well as the answer. From the given question and answer the student will need to within a minimum of six and a maximum of 10 sent. Describe what the data is describing as well as.
- Using statistical terminology, pointing out Important patterns, trends, and relationships
- Each step is written out on how the answer was solved
- Connections to other applications or statistical methods were made.
- Insightful implications of findings are discussed.
- Specific and insightful questions for further inquiry were given
- Ending with a well-developed conclusion to the findings.
---------------------------------------------------------------------------------------------------------------------------------------------------------------------
-- Problem --
--------------------------------------------------------------------------------------------------------------------------------------------------------------------
--Question --
--------------------------------------------------------------------------------------------------------------------------------------------------------------------
-- Answer -
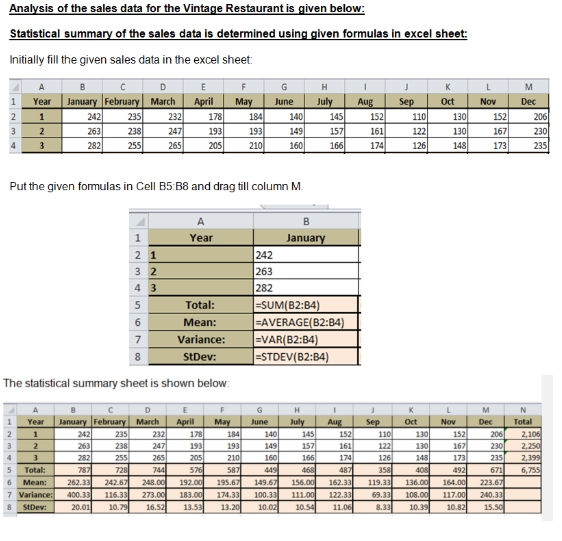
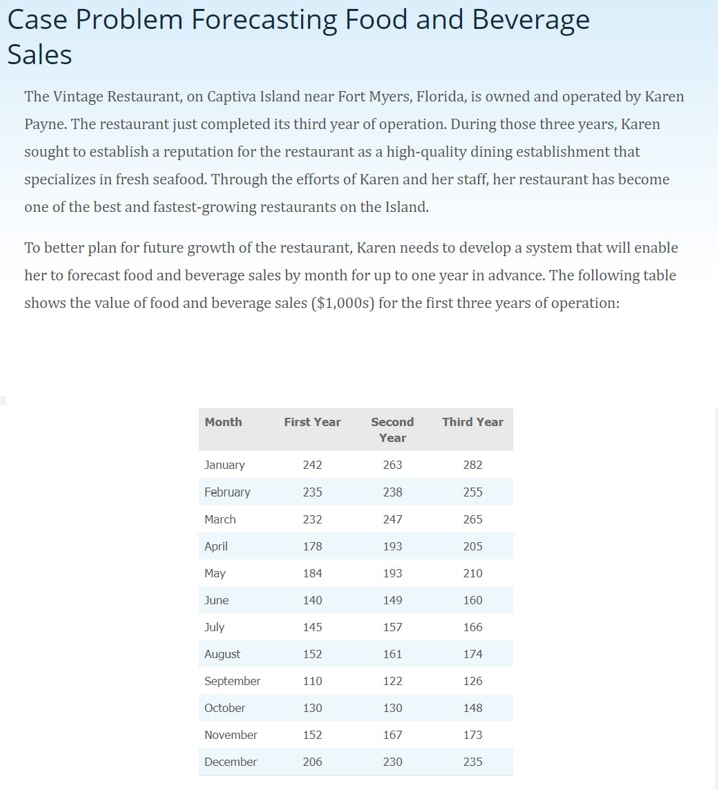
Analysis of the sales data for the Vintage Restaurant is given below: Statistical summary of the sales data is determined using given formulas in excel sheet: Initially fill the given sales data in the excel sheet: 1234 D E F G H 1 J K L M Year January February March April May June July Aug Sep Oct Nov Dec 1 242 235 232 178 184 140 145 152 110 130 152 206 2 263 238 247 193 193 149 157 161 122 130 167 230 3 282 255 265 205 210 160 166 174 126 148 173 235 Put the given formulas in Cell B5:B8 and drag till column M. A B 1 Year January 21 242 32 263 43 282 5 Total: 670 Mean: Variance: 8 StDev: =SUM(B2:B4) =AVERAGE(B2:B4) =VAR(B2:B4) =STDEV(B2:B4) The statistical summary sheet is shown below: A B D E F G H 1 J K L 1 Year January February March April May June July Aug Sep Oct Nov M Dec N Total 2 1 242 235 232 178 184 140 145 152 110 130 152 206 3 2 263 238 247 193 193 149 157 161 122 130 167 230 82 2,106 2,250 4 3 282 255 265 205 210 160 166 174 126 148 173 235 2,399 5 Total: 787 728 744 576 587 449 468 487 358 408 492 671 6,755 Mean: 262.33 242.67 248.00 192.00 195.67 149.67 156.00 162.33 119.33 136.00 164.00 223.67 7 Variance: 400.33 StDev: 20.01 116.33 10.79 273.00 183.00 174.33 16.52 13.53 13.20 100.33 10.02 111.00 122.33 10.54 11.06 10.39 69.33 108.00 117.00 8.33 240.33 10.82 15.50
Step by Step Solution
There are 3 Steps involved in it
Step: 1
Heres a comprehensive answer to the Vintage Restaurant sales forecasting case study organized with main headings stepbystep calculations and realworld insights Introduction Karen Payne owner of the Vi...
Get Instant Access to Expert-Tailored Solutions
See step-by-step solutions with expert insights and AI powered tools for academic success
Step: 2

Step: 3
Ace Your Homework with AI
Get the answers you need in no time with our AI-driven, step-by-step assistance
Get Started
Contemporary Business Mathematics With Canadian Applications
Authors: Ali R. Hassanlou, S. A. Hummelbrunner, Kelly Halliday
12th Edition
0135285011, 978-0135285015