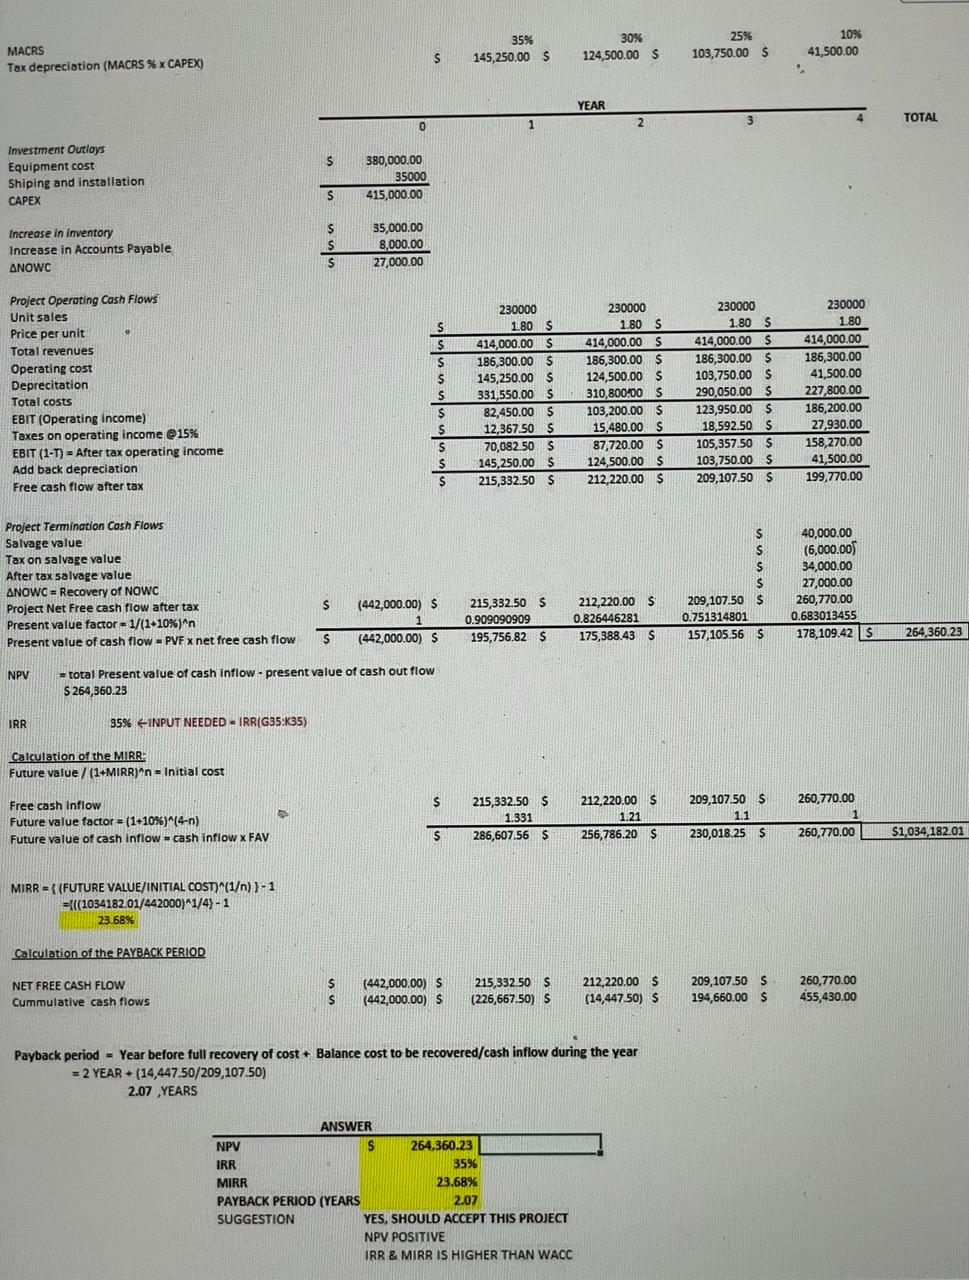
Question
The case study is about capital budgeting and investment decision. **NOTE** 1 paragraph per question is enough. Thanks Part (C) 1. What is sensitivity analysis?

The case study is about capital budgeting and investment decision.
**NOTE** 1 paragraph per question is enough. Thanks
Part (C)
1. What is sensitivity analysis?
2. Perform a sensitivity analysis on the unit sales, salvage value, and WACC for the project. Assume that each of these variables deviates from its base-case, or expected value by plus or minus 10%, 20%, and 30%. Calculate NPV for each case (21 NPV in total: 7 NPV for change in unit sale; 7 NPV for change in salvage value; and 7 NPV for change in WACC), then draw a graph with three lines (one for Unit Sales, one for Salvage Value, and one for WACC, all three lines in the same graph). At the end, perform a sensitivity analysis for the project (what you have seen from your graph, what conclusion you can make?).
3. What can we learn from sensitivity analysis the goal of sensitivity analysis?
4. What is the primary weakness of sensitivity analysis? What are its primary advantages?
5. Your reflection on the sensitivity analysis (what it tells you about the project)?
35% 145,250.00 $ MACRS Tax depreciation (MACRS % x CAPEX) 30% 124,500.00 S 25% 103,750.00 $ 10% 41,500.00 S YEAR TOTAL 2 2 0 1 $ Investment Outlays Equipment cost Shiping and installation CAPEX 380,000.00 35000 415,000.00 S $ $ S Increase in inventory Increase in Accounts Payable ANOWC 35,000.00 8,000.00 27,000.00 $ Project Operating Cash Flows Unit sales Price per unit Total revenues Operating cost Deprecitation Total costs EBIT (Operating income) Taxes on operating income Q15% EBIT (1-T) = After tax operating income Add back depreciation Free cash flow after tax S $ $ $ S $ S S $ 230000 1.80 $ 414,000.00 186,300.00 S 145,250.00 $ 331,550.00 $ 82,450.00 $ 12,367.50 $ 70,082.50 $ 145,250.00 $ 215,332.50 S 230000 1.80 S 414,000.00 $ 186,300.00 $ 124,500.00 $ 310,800.00 S 103,200.00 $ 15,480.00 $ 87,720.00 $ 124,500.00 $ 212,220.00 $ 230000 1.80 $ 414,000.00 $ 186,300.00 S 103,750.00 $ 290,050.00 $ 123,950.00 $ 18,592.50 $ 105,357.50 $ 103,750.00 $ 209,107.50 S 230000 1.80 414,000.00 186,300.00 41,500.00 227,800.00 186,200.00 27,930.00 158,270.00 41,500.00 199,770.00 $ Project Termination Cash Flows Salvage value Tax on salvage value After tax salvage value ANOWC = Recovery of NOWC Project Net Free cash flow after tax Present value factor = 1/(1-10%)'n Present value of cash flow - PVF x net free cash flow $ $ $ $ 209,107.50 $ 0.751314801 157,105,56 S 40,000.00 (6,000.00 34,000.00 27,000.00 260,770.00 0.683013455 178,109.42 $264,360.23 $ (442,000.00) $ 1 (442,000.00) S 215,332.50 $ 0.909090909 195,756.82 $ 212,220.00 $ S 0.826446281 175,388.43 $ S NPV = total Present value of cash inflow - present value of cash out flow S 264,360.23 IRR 35%Step by Step Solution
There are 3 Steps involved in it
Step: 1

Get Instant Access to Expert-Tailored Solutions
See step-by-step solutions with expert insights and AI powered tools for academic success
Step: 2

Step: 3

Ace Your Homework with AI
Get the answers you need in no time with our AI-driven, step-by-step assistance
Get Started


