Answered step by step
Verified Expert Solution
Link Copied!

Question

1 Approved Answer

The Centers for disease Control and Prevention Office on Smoking and Health (OSH) is the lead federal agency responsible for comprehensive tobacco prevention and control.

The Centers for disease Control and Prevention Office on Smoking and Health (OSH) is the lead federal agency responsible for comprehensive tobacco prevention and control. OSH was established in 1965 to reduce the death and disease caused by tobacco use and exposure to second-hand smoke. One of the many responsibilities of the OSH is to collect data on tobacco use. The following data show the percentage of adults in the United States who were users of tobacco from 2001 through 2011 (http://www.cdc.gov/tobacco/data_statistics/tables/trends/cig_smoking/index.htm).

Year Percentage of Adults Who Smoke 2001 22.8 2002 22.5 2003 21.6 2004 20.9 2005 20.9 2006 20.8 2007 19.8 2008 20.6 2009 20.6 2010 19.3 2011 18.9

b. Use simple linear regression to find the parameters for the line that minimizes MSE for this time series. (t = 1 for 2001 year, t = 2 for 2002 year, ... , and t = 11 for 2011 year.). Round your answers to four decimal places. Use minus sign for negative values.

c. One of OSH's Healthy People 2020 Goals is to cut the percentage of adults in the United States who were users of tobacco to 12% or less by the year 2020. Does your regression model from part (b) suggest that the OSH is on target to meet this goal?

If not, use your model from part (b) to estimate the year in which the OSH will achieve this goal.

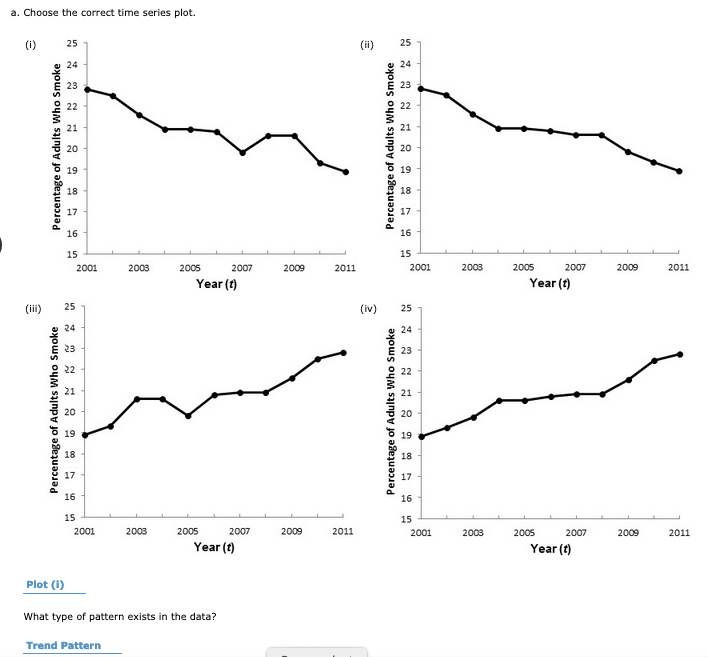
image text in transcribedimage text in transcribedimage text in transcribed
Problem 15-21 The Centers for disease Control and Prevention Office on Smoking and Health (OSH) is the lead federal agency responsible for comprehensive tobacco prevention and control. OSH was established in 1965 to reduce the death and disease caused by tobacco use and exposure to second-hand smoke. One of the many responsibilities of the OSH is to collect data on tobacco use. The following data show the percentage of adults in the United States who were users of tobacco from 2001 through 2011 (http://www.edc.gov/tobacco/data_statistics/tables/trends/cig_smoking/index.htm). Year Percentage of Adults Who Smoke 2001 22.8 2002 22.5 2003 21.6 2004 20.9 2005 20.9 2006 20.8 2007 19.8 2008 20.6 2009 20.6 2010 19.3 2011 18.9a. Choose the correct time series plot. (i) 25 (ii) 25 24 Percentage of Adults Who Smoke Percentage of Adults Who Smoke 23 22 21 20 19 18 17 16 16 15 15 2001 2008 2005 2007 2009 2011 2001 2003 2005 2007 2009 2011 Year (t) Year (t) (iii) 25 (iv) 25 Percentage of Adults Who Smoke 24 Percentage of Adults Who Smoke 24 22 21 20 19 18 17 16 16 15 15 2011 2001 2003 2005 2007 2009 2011 2001 2003 2005 2007 2009 Year (t) Year (t) Plot (i) What type of pattern exists in the data? Trend Patternb. Use simple linear regression to find the parameters for the line that minimizes MSE for this time series. (t = 1 for 2001 year, t = 2 for 2002 year, ... , and t = 11 for 2011 year.). Round your answers to four decimal places. Use minus sign for negative values. Tt = c. One of OSH's Healthy People 2020 Goals is to cut the percentage of adults in the United States who were users of tobacco to 12% or less by the year 2020. Does your regression model from part (b) suggest that the OSH is on target to meet this goal? No If not, use your model from part (b) to estimate the year in which the OSH will achieve this goal. Year

Step by Step Solution

There are 3 Steps involved in it

Step: 1

blur-text-image

Get Instant Access to Expert-Tailored Solutions

See step-by-step solutions with expert insights and AI powered tools for academic success

Step: 2

blur-text-image

Step: 3

blur-text-image

Ace Your Homework with AI

Get the answers you need in no time with our AI-driven, step-by-step assistance

Get Started

Recommended Textbook for

Introduction to Probability

Authors: Mark Daniel Ward, Ellen Gundlach

1st edition

716771098, 978-1319060893, 1319060897, 978-0716771098

More Books

Students also viewed these Mathematics questions

Question

b. Determine the 95% confidence intervals for the parameters.

Answered: 1 week ago

Question

How a multi-output firm prices goods with related demands

Answered: 1 week ago

Question

HOW IS MARKETING CHANGING WITH ARTIFITIAL INTELIGENCE

Answered: 1 week ago

Question

Different types of Grading?

Answered: 1 week ago

Question

Explain the functions of financial management.

Answered: 1 week ago

Question

HOW MANY TOTAL WORLD WAR?

Answered: 1 week ago