Answered step by step
Verified Expert Solution
Link Copied!

Question

1 Approved Answer

The chart below illustrates the adoption of various products (by U.S. Households) since their introduction to the market. The horizontal axis shows each year Be
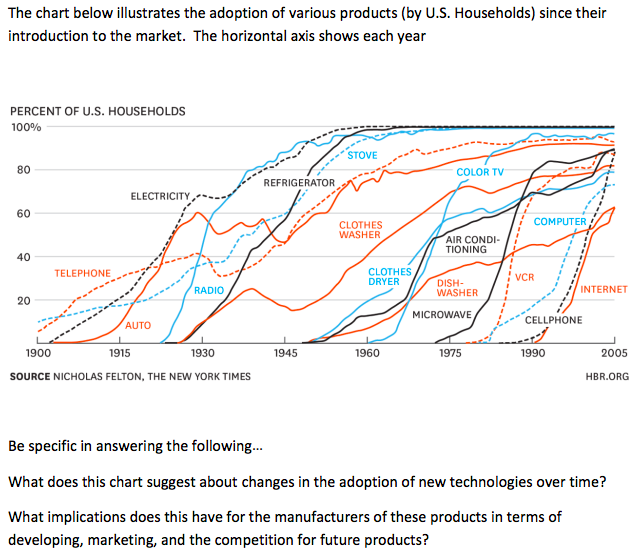
image text in transcribed

The chart below illustrates the adoption of various products (by U.S. Households) since their introduction to the market. The horizontal axis shows each year Be specific in answering the following... What does this chart suggest about changes in the adoption of new technologies over time? What implications does this have for the manufacturers of these products in terms of developing, marketing, and the competition for future products

Step by Step Solution

There are 3 Steps involved in it

Step: 1

blur-text-image

Get Instant Access to Expert-Tailored Solutions

See step-by-step solutions with expert insights and AI powered tools for academic success

Step: 2

blur-text-image_2

Step: 3

blur-text-image_3

Ace Your Homework with AI

Get the answers you need in no time with our AI-driven, step-by-step assistance

Get Started

Recommended Textbook for

Food Supply Chain Management And Logistics

Authors: Samir Dani

2nd Edition

1398600121, 978-1398600126

More Books

Students also viewed these General Management questions

Question

Common defects of the eye?

Answered: 1 week ago

Question

The eye is responsible for producing tears....?

Answered: 1 week ago

Question

Cause on the an increase in pressure with in the eye ?

Answered: 1 week ago

Question

What is the Normal Eye Power ?

Answered: 1 week ago

Question

Thomas Aquinas was born........?

Answered: 1 week ago