

Answered step by step
Verified Expert Solution
Question
1 Approved Answer
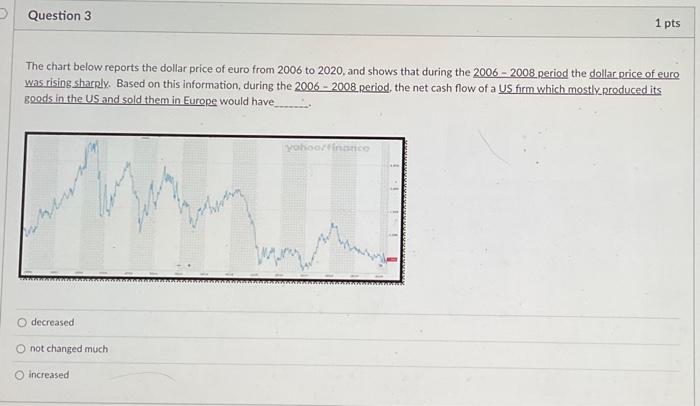
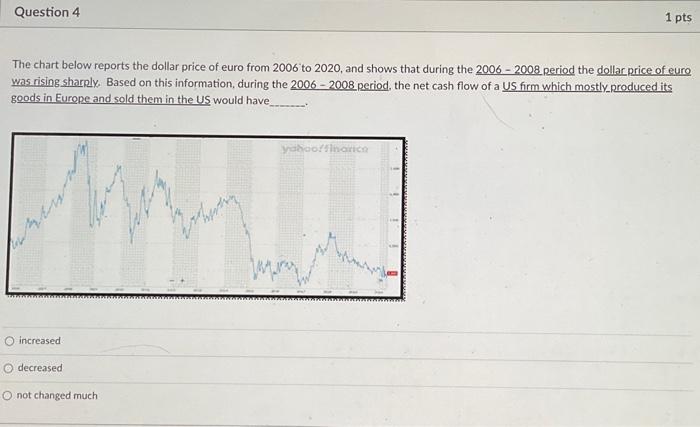
The chart below reports the dollar price of euro from 2006 to 2020 , and shows that during the 20062008 period the dollar price of
Step by Step Solution
There are 3 Steps involved in it
Step: 1

Get Instant Access to Expert-Tailored Solutions
See step-by-step solutions with expert insights and AI powered tools for academic success
Step: 2

Step: 3
Ace Your Homework with AI
Get the answers you need in no time with our AI-driven, step-by-step assistance
Get Started
Writing About Finance And Business
Authors: Alexandrea Geddes
First Canadian Edition
1927023866, 978-1927023860