Answered step by step
Verified Expert Solution
Question
1 Approved Answer
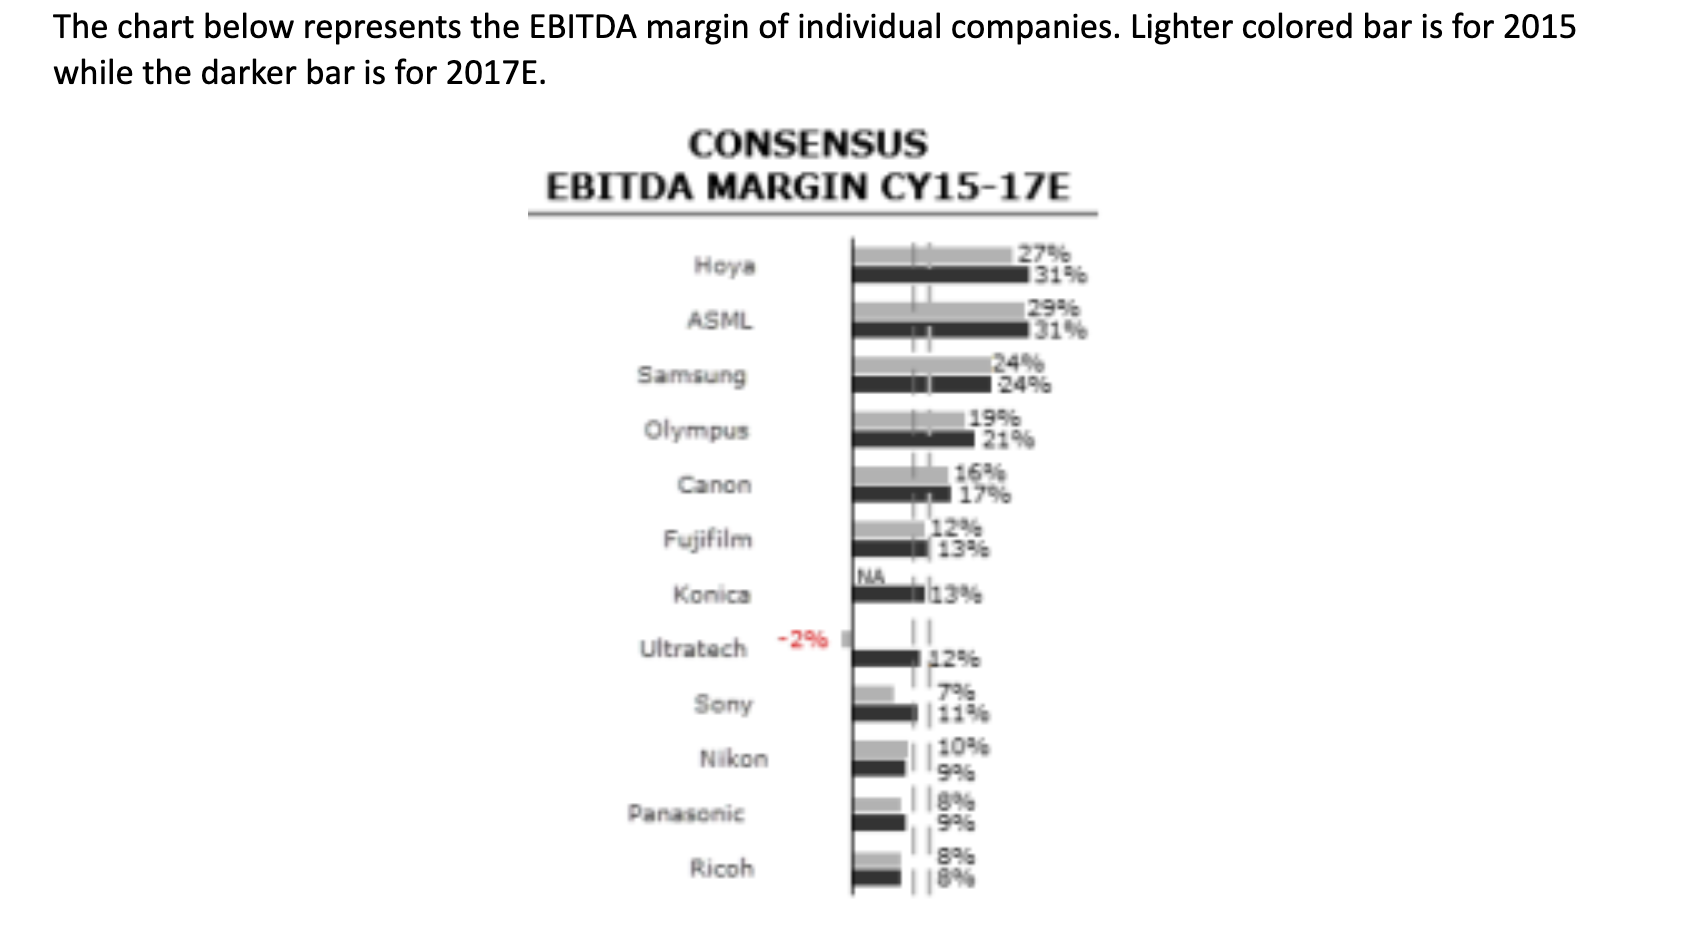
The chart below represents the EBITDA margin of individual companies. Lighter colored bar is for 2015 while the darker bar is for 2017E. How is
 The chart below represents the EBITDA margin of individual companies. Lighter colored bar is for 2015 while the darker bar is for 2017E.
How is the margin spread expected to change over the next two years (refer chart above)?
a. Decrease
b. Increase
c. No change
d. Need more data points to be conclusive
The chart below represents the EBITDA margin of individual companies. Lighter colored bar is for 2015 while the darker bar is for 2017E. CONSENSUS EBITDA MARGIN CY15-17E 1319 299 131% 124% 1998 179% 12% 139 Haya ASML Samsung Olympus Canon Fujifilm Konica Ultratech -29 Sony Nikon Panasonic Ricoh 109 996 996 896Step by Step Solution
There are 3 Steps involved in it
Step: 1

Get Instant Access to Expert-Tailored Solutions
See step-by-step solutions with expert insights and AI powered tools for academic success
Step: 2

Step: 3

Ace Your Homework with AI
Get the answers you need in no time with our AI-driven, step-by-step assistance
Get Started


