

Question
The chart below represents the following possible industries: [a] travel agency; [b] hotel; [c] meat processing companies; and [d] Drug Company. What to Do ?
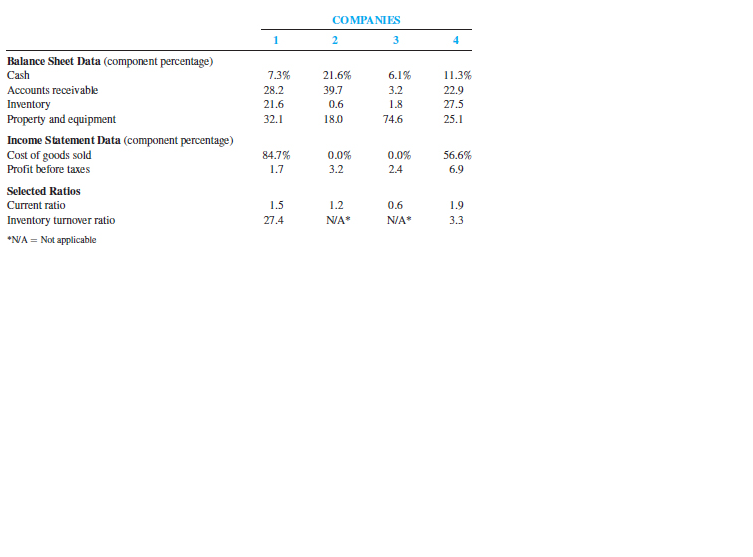
The chart below represents the following possible industries: [a] travel agency; [b] hotel; [c] meat processing companies; and [d] Drug Company.
What to Do ?
Select and match one company (table #1 - #4) to the possible industry choices (a - d).
Explain the answer choice - how does this number above convey to you? Why you think that is and why the other three choices are not indicative of your selected industry norms. Your explanation should include at least three parts - one balance sheet data, one income statement data, and one ratios data.
Why does the balance sheet data and income statement data shows in a "component percentage"? What does that mean and is that a term that refer to "horizontal analysis" or "vertical analysis"?
The investor would have looked at the chart above and will conclude this is not meaningful beyond the academia exercise. Explain why benchmarking a company (Say, American Eagle Outfitters) to determine whether this is a good investment potential by comparing data against this chart is NOT beneficial.
Step by Step Solution
There are 3 Steps involved in it
Step: 1

Get Instant Access to Expert-Tailored Solutions
See step-by-step solutions with expert insights and AI powered tools for academic success
Step: 2

Step: 3
Ace Your Homework with AI
Get the answers you need in no time with our AI-driven, step-by-step assistance
Get Started
Financial Accounting For Decision Makers
Authors: Peter Atrill, Eddie McLaney
10th Edition
1292409185, 9781292409184