

Question
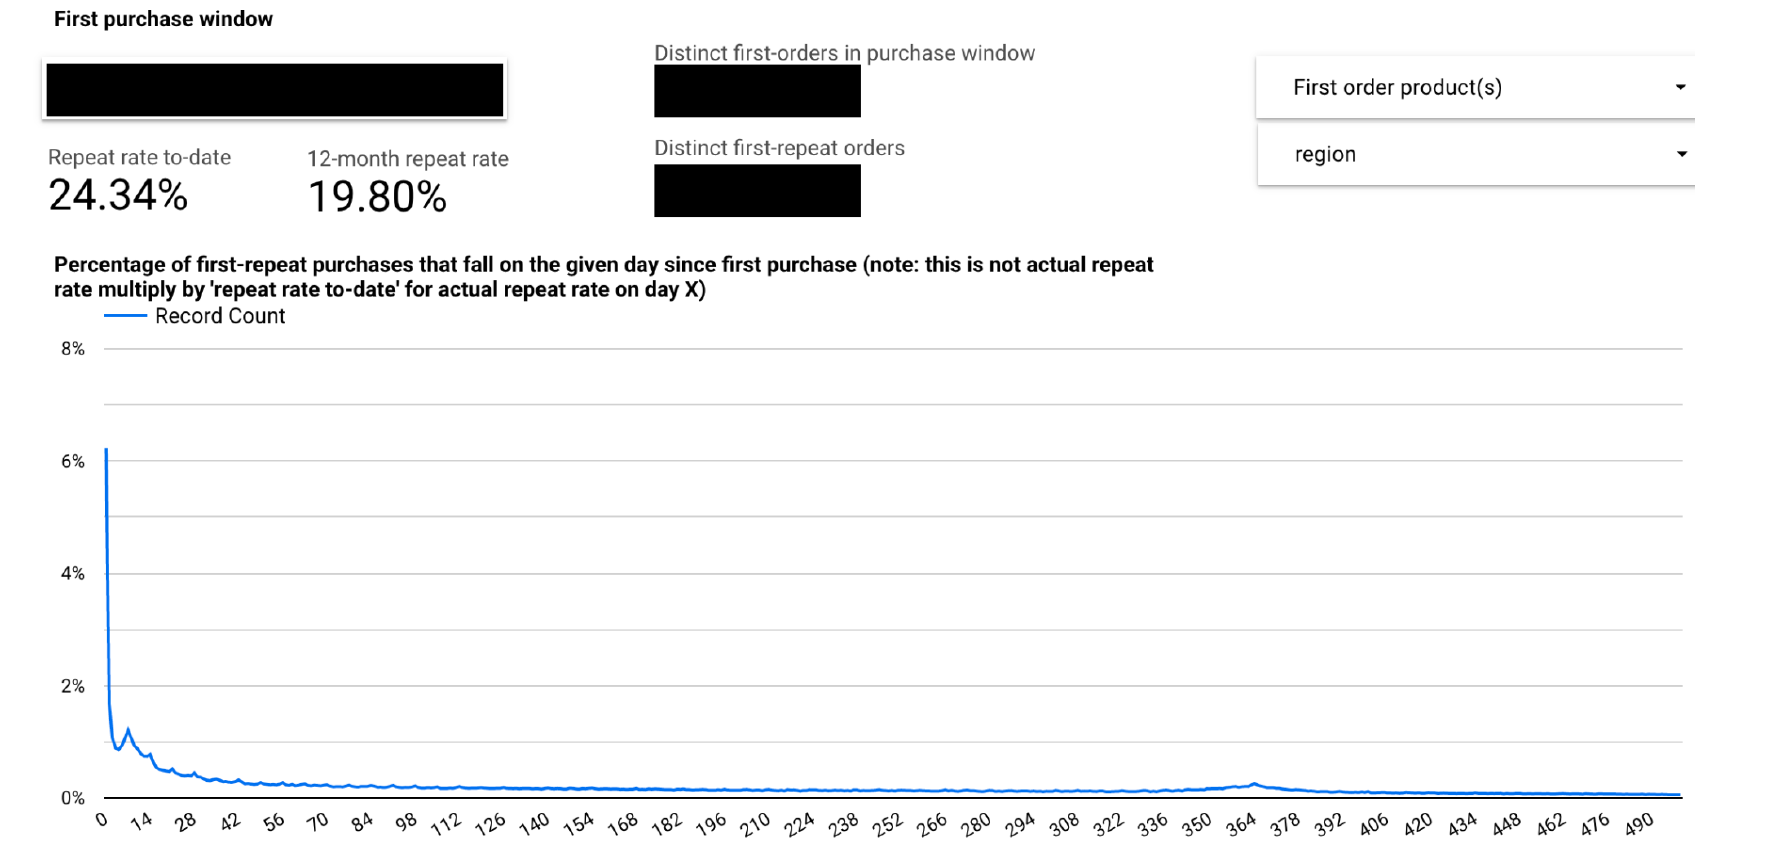
The chart below shows the repeat rate for new customers over a set period of time. You should read the curve as Of the customers
The chart below shows the repeat rate for new customers over a set period of time. You should
read the curve as "Of the customers that repeat, x% do so within x days of their first purchase."
Please answer the following questions and be prepared to discuss in detail
Step by Step Solution
There are 3 Steps involved in it
Step: 1

Get Instant Access to Expert-Tailored Solutions
See step-by-step solutions with expert insights and AI powered tools for academic success
Step: 2

Step: 3
Ace Your Homework with AI
Get the answers you need in no time with our AI-driven, step-by-step assistance
Get Started
Introduction to Operations Research
Authors: Frederick S. Hillier, Gerald J. Lieberman
10th edition
978-0072535105, 72535105, 978-1259162985