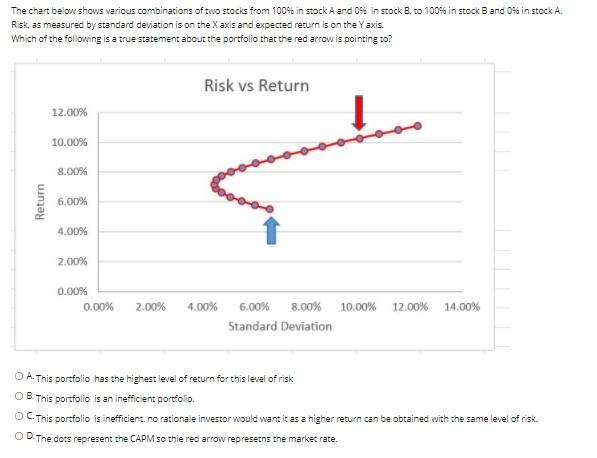
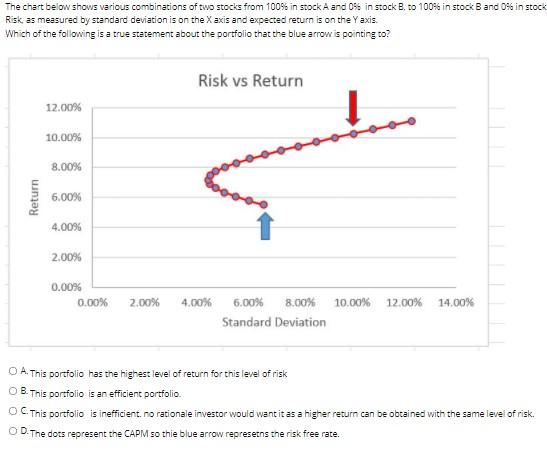
The chart below shows various combinations of two stocks from 100% in stock A and 0% in stock B, to 100% in stock Band 0% in stock A. Risk, as measured by standard deviation is on the X axis and expected return is on the Yaxis. Which of the following is a true statement about the portfolio that the red arrow is pointing to? a Risk vs Return 12.00% 10.00% 8.00% Return 6,00% 4.00% 2.00% 0.00% 0.00% 2.00% 4.00% 6.00% 8.00% 10.00% 12.00% 14.00% Standard Deviation O A. This portfolio has the highest level of return for this level of risk OB. This portfolio is an inefficient portfolio OC. This portfolio is inefficient no rationale investor would want it as a higher return can be obtained with the same level of risk O D.The dots represent the CAPM so thie red arrow represets the market rate. The chart below shows various combinations of two stocks from 100% in stock A and 05 in stock B. to 100% in stock Band 0% in stock Risk as measured by standard deviation is on the X axis and expected return is on the Yaxis Which of the following is a true statement about the portfolio that the blue arrow is pointing to? Risk vs Return 12.00% 10.00% 8.00% Return 6.00% 4.0096 2.00% 0.00% 0.00% 2.00% 4.00% 12.00% 14.00% 6.00% 8.00% 10.00% Standard Deviation O A. This portfolio has the highest level of return for this level of risk OB. This portfolio is an efficient portfolio OC. This portfolio is inefficient. no rationale investor would want it as a higher return can be obtained with the same level of risk. OD. The dots represent the CAPM so thie blue arrow represetns the risk free rate. The chart below shows various combinations of two stocks from 100% in stock A and 0% in stock B, to 100% in stock Band 0% in stock A. Risk, as measured by standard deviation is on the X axis and expected return is on the Yaxis. Which of the following is a true statement about the portfolio that the red arrow is pointing to? a Risk vs Return 12.00% 10.00% 8.00% Return 6,00% 4.00% 2.00% 0.00% 0.00% 2.00% 4.00% 6.00% 8.00% 10.00% 12.00% 14.00% Standard Deviation O A. This portfolio has the highest level of return for this level of risk OB. This portfolio is an inefficient portfolio OC. This portfolio is inefficient no rationale investor would want it as a higher return can be obtained with the same level of risk O D.The dots represent the CAPM so thie red arrow represets the market rate. The chart below shows various combinations of two stocks from 100% in stock A and 05 in stock B. to 100% in stock Band 0% in stock Risk as measured by standard deviation is on the X axis and expected return is on the Yaxis Which of the following is a true statement about the portfolio that the blue arrow is pointing to? Risk vs Return 12.00% 10.00% 8.00% Return 6.00% 4.0096 2.00% 0.00% 0.00% 2.00% 4.00% 12.00% 14.00% 6.00% 8.00% 10.00% Standard Deviation O A. This portfolio has the highest level of return for this level of risk OB. This portfolio is an efficient portfolio OC. This portfolio is inefficient. no rationale investor would want it as a higher return can be obtained with the same level of risk. OD. The dots represent the CAPM so thie blue arrow represetns the risk free rate