Answered step by step
Verified Expert Solution
Question
1 Approved Answer
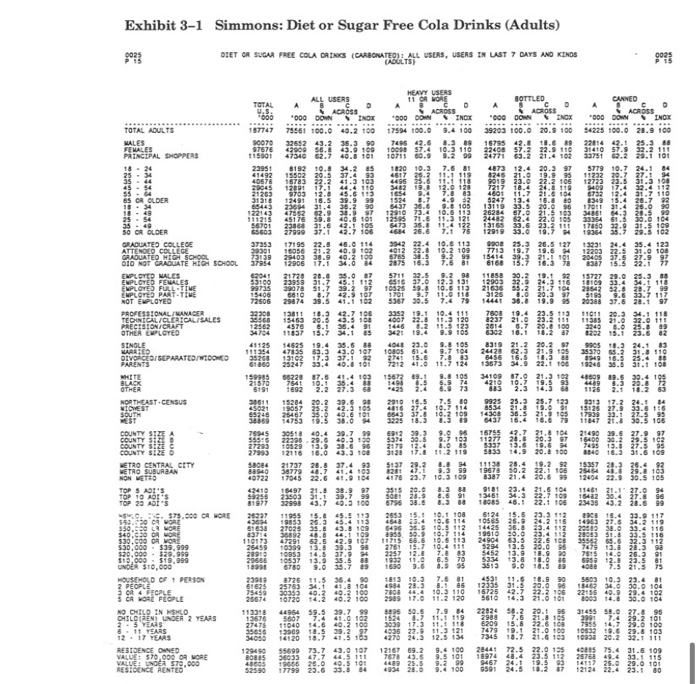
the chart is used to help answerr the question for the relationship between the two 4. Looking at Exhibit 3-1 (Attached), is there a relationship


the chart is used to help answerr the question for the relationship between the two
4. Looking at Exhibit 3-1 (Attached), is there a relationship between heavy use of diet or sugar free cola and household income? What is that relationship? Use the data to describe. (5 points) Exhibit 3-1 Simmons: Diet or Sugar Free Cola Drinks (Adults) DIET OR SUGAR FREE COLA DRINES (CARBONATEO) - ALL USERS, USERS IN UST 7 DAYS AND KINOS 9093 BOTTLED ACROSS 000 DOWN INOX 39203 100.0 20.9 100 18.6 39 000 CANNED D ACROSS DOWN INOX 28.9 100 25.3 88 32.2 111 20.1 ioi 24.1 84 94 40 g 12.4 20.2 92 31:10 18.4 24.0 11. 21.6 20.0 7.0 21.5 32.4 11 31.7 110 28.7 82 26.0 90 30.5 30.0 104 14441 38.8 19.9 WHITE 10 23.7 10.3109 HEAVY USERS ALL USERS 11 OR WORE A D ACROSS ACROSS 000 DOWN 000 DOWN INOX TOTAL ADULTS 100.0 40.2 100 17594 100.0 9.4 100 MALES 35.3 90 7496 42.6 8.3 89 FEMALES 7.4 10.3 110 PRINCIPAL SHOPPERS 18.20 10.8 34.25 7.6 81 35.44 41.3 11.1 118 45.54 17.1 44.417 12.0 120 55.6 12.8 49.6 7.8 83 SS OR OLDER 4.9 16.3 31.4 36.299 9.6 105 10.49 2.5 59.8 40.6 toi 10.6 11.3 35-49 42.1 50 OR OLDER GRADUATED COLLEGE ATTENDED COLLEGE GRADUATED HIGH SCHOOL DID NOT GRADUATE HIGH SCHOOL EMPLOYED WALES ENPLCTED FEMALES EMPLOYES FULL-TIME EMPLOTE PART TIME NOT EMPLOYED 39.5 41.1 30.5 7.4 79 PROFESSIONAL MANAGER 19.1 10. TECHNICAL/CLERICAL / SALES 22.8 11.3 PRECISION CRAFT 1446 1.2 11.5 123 OTHER EMPLOYED 9.9 105 35.6 80 4041 23.0 9.8 105 KARATED 10805 1.4 9.7 104 PIVORCED SEPARATED/WIDONEO 214115.6 7.4 43 PARENTS 33.440.0 101 7212 41.0 11.2 124 41.4193 15612 89.1 9.8 105 OTHER +425 NORTHEAST CENSUS 2910 NICWEST SOUTH 8643 WEST 3225 18.3 13.938.6 8.0 85 16.0 43.3 100 ETAO CENTRAL CITY 28.8 37.4 8.894 WETRO SUBURAN 9.3 NON METRO 41.. TOP SADIS TO AOS 69.3 100 9.573.000 OR MORE 15. 9.9 2553 15.1 10.1 100 1848 23.4 0.6 114 35.8 13.8 5496 35.9 10.112 40.8 14.1 109 895559. 10. 114 52.5 42.9 107 11715 6.6 10.6 113 $39.999 13.8 39.3 2761 15.7 10.4 111 1.999 14.6 37 2257 13.87.8 83 999 UNDER $10,000 35.5 383 11.6 HOUSEHOLD OF 1 PERSON 1813 10.3 2 PEOPLE CAROPLE 4. SCR MORE PEOPLE 17.0 11.2 120 NO OLD IN SMO 7.9 84 CHILDREN UNDER 2 YEARS 8.7 11.1 2.5 YEARS 11.3 11.0 6 11 YEARS 22. 11.3 121 12.17 YEARS 24.3 12.5 134 RESIDENCE OWNED 73.7 43.9 107 12167 69.2 9.4 100 VALUE: 570,000 OR MORE 46.5 111 7678 43.6 9.5 101 VALUE: ENDER $10.000 40. 449 25.5 9.2 99 RESIOENCE RENTED 9.4 100 23. 33. 37.6 28.197 20.2 34. 32.0 0.0 35.0 15.1 23.6 18.2 24.1 83 5.2 31.8 119 16.5 25. 19246 35.5 31.1 108 0.7 6392 10.1 8319 21.2 20.2 97 62.3 16.3 18.3 13573 34.9 22.1 106 34109 87.9 2.3 SENALE 6431 16.4 16.678 21.6 104 19.6 5833 14.9 20.8 21.8 30.5 106 1.997 838 6124 NURANO 19.4 13.9 117 34.2 119 38.6 33.4 118 91.4 33.5 110 32.3 112 28.3 sa 14.0 26.3 91 23.5 21.5 75 99.9 37.8 29.2 29.0 100 29.8 103 75.6 31.6 109 33.1 115 29.0 101 00 4. Looking at Exhibit 3-1 (Attached), is there a relationship between heavy use of diet or sugar free cola and household income? What is that relationship? Use the data to describe. (5 points) Exhibit 3-1 Simmons: Diet or Sugar Free Cola Drinks (Adults) DIET OR SUGAR FREE COLA DRINES (CARBONATEO) - ALL USERS, USERS IN UST 7 DAYS AND KINOS 9093 BOTTLED ACROSS 000 DOWN INOX 39203 100.0 20.9 100 18.6 39 000 CANNED D ACROSS DOWN INOX 28.9 100 25.3 88 32.2 111 20.1 ioi 24.1 84 94 40 g 12.4 20.2 92 31:10 18.4 24.0 11. 21.6 20.0 7.0 21.5 32.4 11 31.7 110 28.7 82 26.0 90 30.5 30.0 104 14441 38.8 19.9 WHITE 10 23.7 10.3109 HEAVY USERS ALL USERS 11 OR WORE A D ACROSS ACROSS 000 DOWN 000 DOWN INOX TOTAL ADULTS 100.0 40.2 100 17594 100.0 9.4 100 MALES 35.3 90 7496 42.6 8.3 89 FEMALES 7.4 10.3 110 PRINCIPAL SHOPPERS 18.20 10.8 34.25 7.6 81 35.44 41.3 11.1 118 45.54 17.1 44.417 12.0 120 55.6 12.8 49.6 7.8 83 SS OR OLDER 4.9 16.3 31.4 36.299 9.6 105 10.49 2.5 59.8 40.6 toi 10.6 11.3 35-49 42.1 50 OR OLDER GRADUATED COLLEGE ATTENDED COLLEGE GRADUATED HIGH SCHOOL DID NOT GRADUATE HIGH SCHOOL EMPLOYED WALES ENPLCTED FEMALES EMPLOYES FULL-TIME EMPLOTE PART TIME NOT EMPLOYED 39.5 41.1 30.5 7.4 79 PROFESSIONAL MANAGER 19.1 10. TECHNICAL/CLERICAL / SALES 22.8 11.3 PRECISION CRAFT 1446 1.2 11.5 123 OTHER EMPLOYED 9.9 105 35.6 80 4041 23.0 9.8 105 KARATED 10805 1.4 9.7 104 PIVORCED SEPARATED/WIDONEO 214115.6 7.4 43 PARENTS 33.440.0 101 7212 41.0 11.2 124 41.4193 15612 89.1 9.8 105 OTHER +425 NORTHEAST CENSUS 2910 NICWEST SOUTH 8643 WEST 3225 18.3 13.938.6 8.0 85 16.0 43.3 100 ETAO CENTRAL CITY 28.8 37.4 8.894 WETRO SUBURAN 9.3 NON METRO 41.. TOP SADIS TO AOS 69.3 100 9.573.000 OR MORE 15. 9.9 2553 15.1 10.1 100 1848 23.4 0.6 114 35.8 13.8 5496 35.9 10.112 40.8 14.1 109 895559. 10. 114 52.5 42.9 107 11715 6.6 10.6 113 $39.999 13.8 39.3 2761 15.7 10.4 111 1.999 14.6 37 2257 13.87.8 83 999 UNDER $10,000 35.5 383 11.6 HOUSEHOLD OF 1 PERSON 1813 10.3 2 PEOPLE CAROPLE 4. SCR MORE PEOPLE 17.0 11.2 120 NO OLD IN SMO 7.9 84 CHILDREN UNDER 2 YEARS 8.7 11.1 2.5 YEARS 11.3 11.0 6 11 YEARS 22. 11.3 121 12.17 YEARS 24.3 12.5 134 RESIDENCE OWNED 73.7 43.9 107 12167 69.2 9.4 100 VALUE: 570,000 OR MORE 46.5 111 7678 43.6 9.5 101 VALUE: ENDER $10.000 40. 449 25.5 9.2 99 RESIOENCE RENTED 9.4 100 23. 33. 37.6 28.197 20.2 34. 32.0 0.0 35.0 15.1 23.6 18.2 24.1 83 5.2 31.8 119 16.5 25. 19246 35.5 31.1 108 0.7 6392 10.1 8319 21.2 20.2 97 62.3 16.3 18.3 13573 34.9 22.1 106 34109 87.9 2.3 SENALE 6431 16.4 16.678 21.6 104 19.6 5833 14.9 20.8 21.8 30.5 106 1.997 838 6124 NURANO 19.4 13.9 117 34.2 119 38.6 33.4 118 91.4 33.5 110 32.3 112 28.3 sa 14.0 26.3 91 23.5 21.5 75 99.9 37.8 29.2 29.0 100 29.8 103 75.6 31.6 109 33.1 115 29.0 101 00 Step by Step Solution
There are 3 Steps involved in it
Step: 1

Get Instant Access to Expert-Tailored Solutions
See step-by-step solutions with expert insights and AI powered tools for academic success
Step: 2

Step: 3

Ace Your Homework with AI
Get the answers you need in no time with our AI-driven, step-by-step assistance
Get Started


