

Question
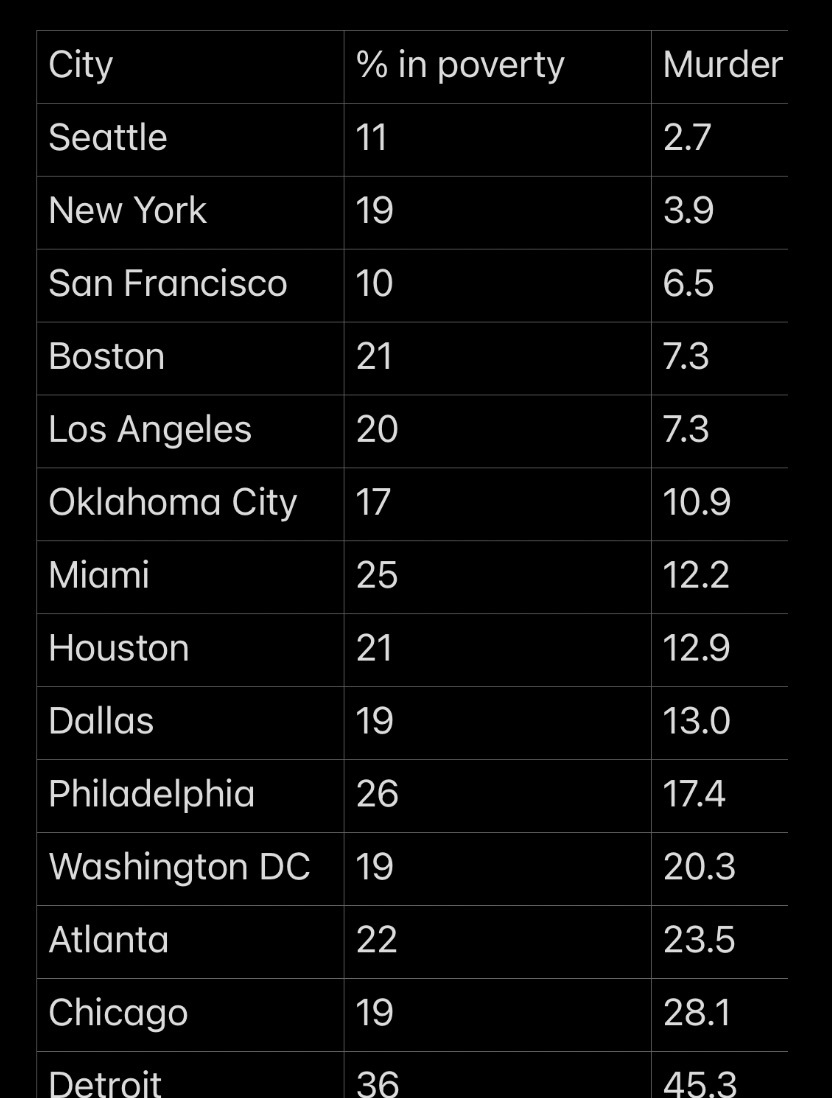
The chart list 14 cities and its poverty and murder rate. The mean for the poverty rate is 20.4 and 15.1 for the murder rate.
The chart list 14 cities and its poverty and murder rate. The mean for the poverty rate is 20.4 and 15.1 for the murder rate. Standard deviation for poverty is 6.3 and 11.4 for murder. The standard error of the regression coefficient is .35. Calculate a statistical test to determine if the regression coefficient differs from 0. State the research and null hypothesis. What is the approximate probability of making a Type I error? What do you conclude about the nature of the linear relationship between the two variables?Also can you please solve by hand I do not use stats software? Thank you so much!
Step by Step Solution
There are 3 Steps involved in it
Step: 1

Get Instant Access to Expert-Tailored Solutions
See step-by-step solutions with expert insights and AI powered tools for academic success
Step: 2

Step: 3
Ace Your Homework with AI
Get the answers you need in no time with our AI-driven, step-by-step assistance
Get Started
Practical Linear Algebra A Geometry Toolbox
Authors: Gerald Farin, Dianne Hansford
4th Edition
1003051219, 9781003051213