Question
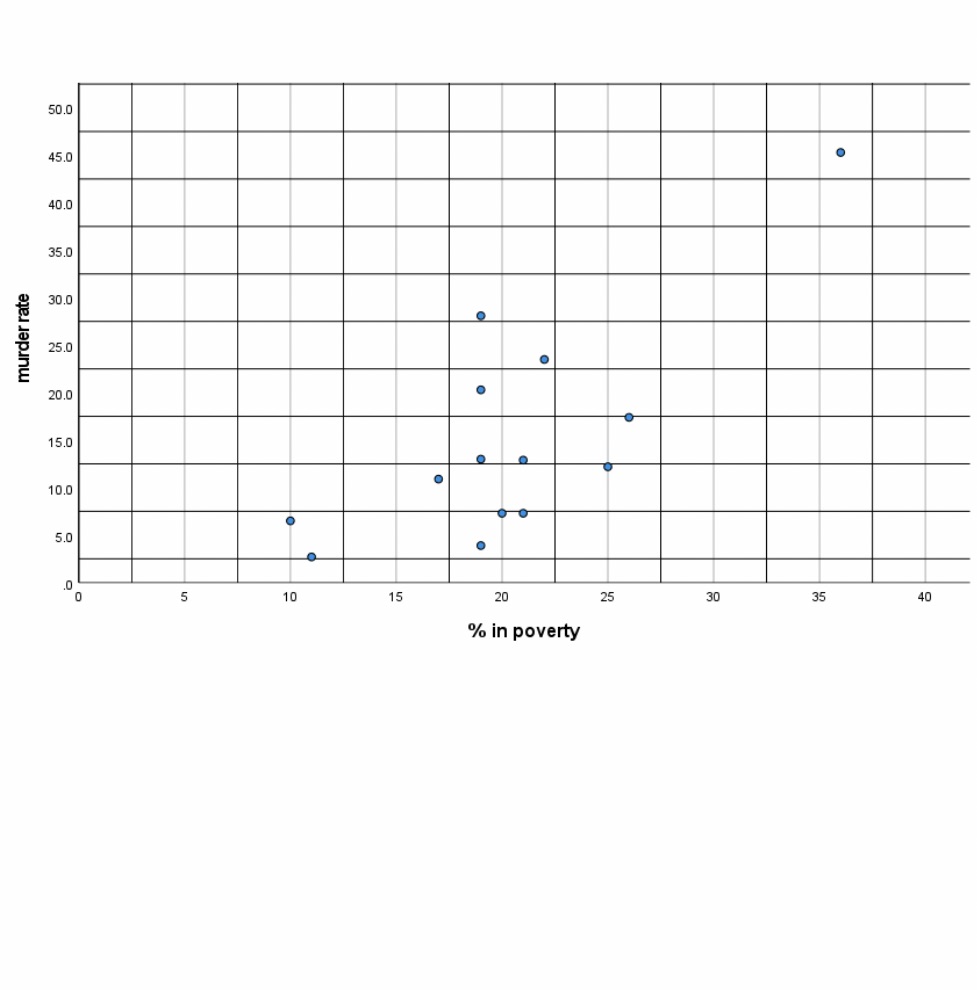
The chart list 14 cities and its poverty and murder rate. The mean for the poverty rate is 20.4 and 15.1 for the murder rate.
The chart list 14 cities and its poverty and murder rate. The mean for the poverty rate is 20.4 and 15.1 for the murder rate. Standard deviation for poverty is 6.3 and 11.4 for murder. Chart:City/ % of poverty/ murder rateSeattle/ 11/ 2.7New York/ 19/ 3.9San Francisco/10/ 6.5Boston/ 21/ 7.3Los Angeles/20 / 7.3Oklahoma City/ 17/ 10.9Miami / 25/ 12.2Houston/ 21/ 12.9Dallas/ 19/ 13.0Philadelphia / 26/ 17.4Washington DC /19/ 20.3Atlanta / 22 / 23.5Chicago/ 19 / 28.1Detroit /36/ 45.3How should I specify the data points in the scatterplot corresponding to Chicago, Detroit, and Houston. Correctly graph the regression line in the scatterplot below.Also can you please solve by hand I do not use stats software? Thank you so much!

Step by Step Solution
There are 3 Steps involved in it
Step: 1

Get Instant Access to Expert-Tailored Solutions
See step-by-step solutions with expert insights and AI powered tools for academic success
Step: 2

Step: 3

Ace Your Homework with AI
Get the answers you need in no time with our AI-driven, step-by-step assistance
Get Started


