

Question
The chart shows a country s annual egg production Model the data in the chart with a linear function using the points 3 63 3
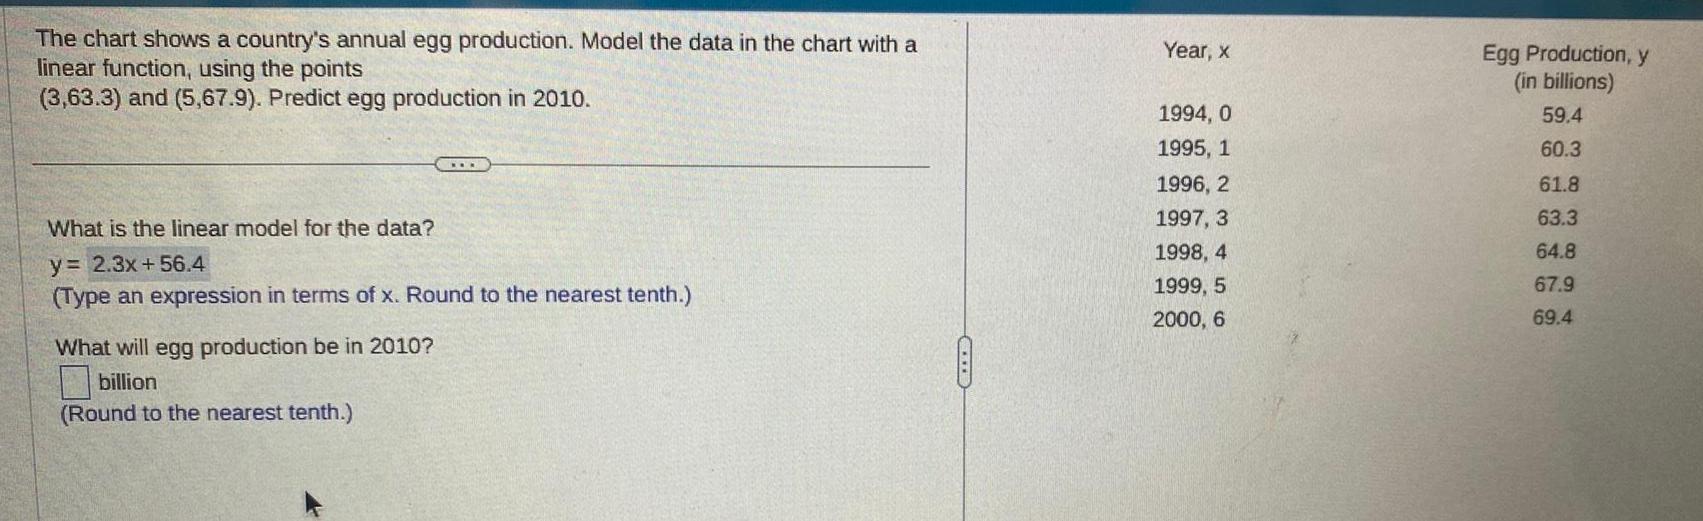

The chart shows a country s annual egg production Model the data in the chart with a linear function using the points 3 63 3 and 5 67 9 Predict egg production in 2010 What is the linear model for the data y 2 3x 56 4 Type an expression in terms of x Round to the nearest tenth What will egg production be in 2010 billion Round to the nearest tenth Year x 1994 0 1995 1 1996 2 1997 3 1998 4 1999 5 2000 6 Egg Production y in billions 59 4 60 3 61 8 63 3 64 8 67 9 69 4
Step by Step Solution
There are 3 Steps involved in it
Step: 1

Get Instant Access to Expert-Tailored Solutions
See step-by-step solutions with expert insights and AI powered tools for academic success
Step: 2

Step: 3
Ace Your Homework with AI
Get the answers you need in no time with our AI-driven, step-by-step assistance
Get Started
Calculus Early Transcendentals
Authors: Jon Rogawski
1st Edition
1429281685, 9781429281683