Answered step by step
Verified Expert Solution
Question
1 Approved Answer
The CIO wants to propose investment limits on certain asset classes to the IPC for consideration, but the CIO may not be aware of the


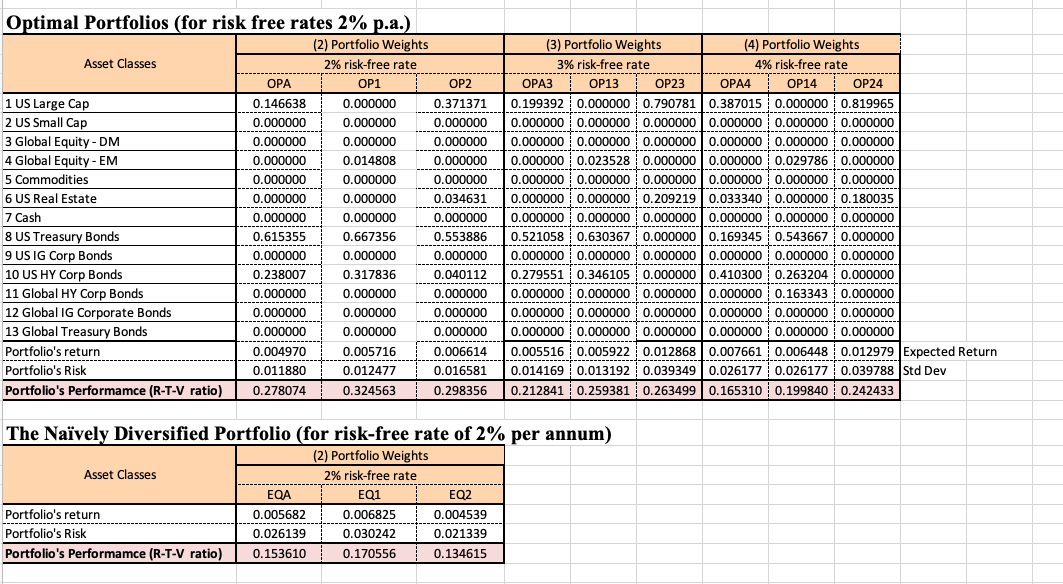
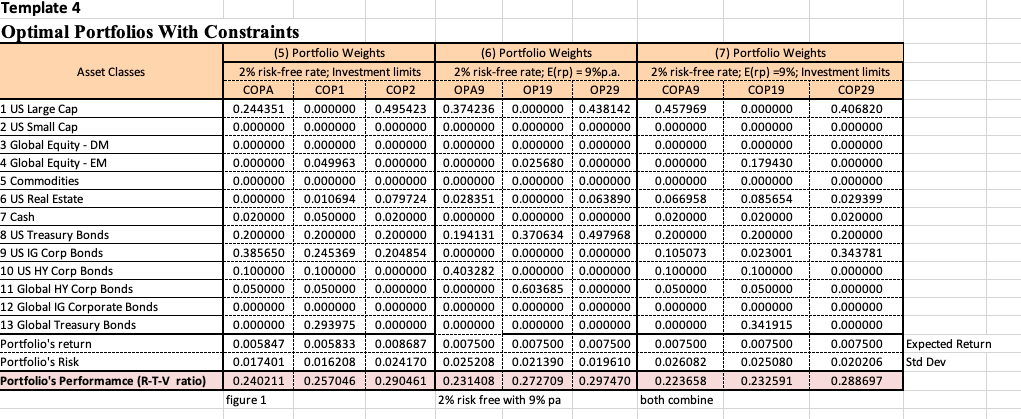
The CIO wants to propose investment limits on certain asset classes to the IPC for consideration, but the CIO may not be aware of the likely impact of the performance of the Fund. Since you have run some analysis above based on the proposed limits, present your analysis, and make a recommendation regarding investment limits for the historical arithmetic average (target) return and the 9% p.a. Target return.
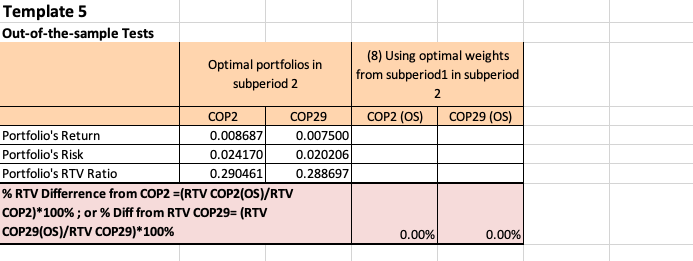
Optimal Portfolios (for risk free rates 2% p.a.) (2) Portfolio Weights Asset Classes 2% risk-free rate OPA OP1 OP2 1 US Large Cap 0.146638 0.000000 0.371371 . ---- 2 US Small Cap 0.000000 0.000000 0.000000 3 Global Equity - DM 0.000000 0.000000 0.000000 --------- 4 Global Equity - EM 0.000000 0.014808 0.000000 5 Commodities 0.000000 0.000000 0.000000 6 US Real Estate 0.000000 0.000000 0.034631 7 Cash 0.000000 0.000000 0.000000 8 US Treasury Bonds 0.615355 0.667356 0.553886 9 US IG Corp Bonds 0.000000 0.000000 0.000000 10 US HY Corp Bonds 0.238007 0.317836 0.040112 11 Global HY Corp Bonds 0.000000 0.000000 0.000000 12 Global IG Corporate Bonds 0.000000 0.000000 0.000000 13 Global Treasury Bonds 0.000000 0.000000 0.000000 Portfolio's return 0.004970 0.005716 0.006614 Portfolio's Risk 0.011880 0.012477 0.016581 Portfolio's Performamce (R-T-V ratio) 0.278074 0.324563 0.298356 (3) Portfolio Weights (4) Portfolio Weights 3% risk-free rate 4% risk-free rate OPA3 OP13 OP23 OPA4 OP14 OP24 0.199392 0.000000 0.7907810.387015 0.000000 0.819965 0.000000 0.000000 0.000000 0.000000 0.000000 0.000000 0.000000 0.000000 0.000000 0.000000 0.000000 0.000000 --------- 0.000000 0.023528 0.000000 0.000000 0.029786 0.000000 0.000000 0.000000 0.000000 0.000000 0.000000 0.000000 0.000000 0.000000 0.209219 0.033340 0.000000 0.180035 0.000000 0.000000 0.000000 0.000000 0.000000 0.000000 0.521058 0.630367 0.000000 0.169345 0.543667 0.000000 0.000000 0.000000 0.000000 0.000000 0.000000 0.000000 0.279551 0.346105 0.000000 0.4103000.263204 0.000000 0.000000 0.000000 0.000000 0.000000 0.163343 0.000000 0.000000 0.000000 0.000000 0.000000 0.000000 0.000000 0.000000 0.000000 0.000000 0.000000 0.000000 0.000000 0.005516 0.005922 0.0128680.007661 0.006448 0.012979 Expected Return 0.014169 0.013192 0.039349 0.026177 0.026177 0.039788 Std Dev 0.212841 0.259381 0.263499 0.165310 0.199840 0.242433 The Navely Diversified Portfolio (for risk-free rate of 2% per annum) (2) Portfolio Weights Asset Classes 2% risk-free rate EQA EQ1 EQ2 Portfolio's return 0.005682 0.006825 0.004539 Portfolio's Risk 0.026139 0.030242 0.021339 Portfolio's Performamce (R-T-V ratio) 0.153610 0.170556 0.134615 Template 4 Optimal Portfolios With Constraints (5) Portfolio Weights (6) Portfolio Weights Asset Classes 2% risk-free rate; Investment limits 2% risk-free rate; E(rp) = 9%p.a. COPA COD COP1 COP2 OPAS OP19 OP29 1 US Large Cap 0.244351 0.000000 0.495423 0.374236 0.000000 0.438142 2 US Small Cap 0.000000 0.000000 0.000000 0.000000 0.000000 0.000000 3 Global Equity - DM 0.000000 0.000000 0.000000 0.000000 0.000000 0.000000 4 Global Equity - EM 0.000000 0.049963 0.000000 0.000000 0.025680 0.000000 5 Commodities 0.000000 0.000000 0.000000 0.000000 0.000000 0.000000 6 US Real Estate 0.000000 0.010694 0.079724 0.028351 0.000000 0.063890 7 Cash 0.020000 0.050000 0.020000 0.000000 0.000000 0.000000 8 US Treasury Bonds 0.200000 0.200000 0.200000 0.194131 0.370634 0.497968 9 US IG Corp Bonds 0.385650 0.245369 0.204854 0.000000 0.000000 0.000000 10 US HY Corp Bonds 0.100000 0.100000 0.000000 0.403282 0.000000 0.000000 11 Global HY Corp Bonds 0.050000 0.050000 0.000000 0.000000 0.603685 0.000000 12 Global IG Corporate Bonds 0.000000 0.000000 0.000000 0.000000 0.000000 0.000000 13 Global Treasury Bonds 0.000000 0.293975 0.000000 0.000000 0.000000 0.000000 Portfolio's return 0.005847 0.005833 0.008687 0.007500 0.0075000.007500 Portfolio's Risk 0.017401 0.016208 0.024170 0.025208 0.021390 0.019610 Portfolio's Performamce (R-T-V ratio) 0.240211 0.257046 0.290461 0.231408 0.231408 0.272709 0.2727090.297470 figure 1 2% risk free with 9% pa (7) Portfolio Weights 2% risk-free rate; E(rp) =9%; Investment limits COPAS COP19 COP29 0.457969 0.000000 0.406820 0.000000 0.000000 0.000000 0.000000 0.000000 0.000000 0.000000 0.179430 0.000000 0.000000 0.000000 0.000000 0.066958 0.085654 0.029399 0.020000 0.020000 0.020000 0.200000 0.200000 0.200000 0.105073 0.023001 0.343781 0.100000 0.100000 0.000000 0.050000 0.050000 0.000000 0.000000 0.000000 0.000000 0.000000 0.341915 0.000000 0.007500 0.007500 0.007500 0.026082 0.025080 0.020206 0.223658 0.232591 0.288697 both combine Expected Return Std Dev Template 5 Out-of-the-sample Tests Optimal portfolios in subperiod 2 (8) Using optimal weights from subperiodi in subperiod 2 COP2 (OS) COP29 (OS) COP2 COP29 Portfolio's Return 0.008687 0.007500 Portfolio's Risk 0.024170 0.020206 Portfolio's RTV Ratio 0.290461 0.288697 % RTV Differrence from COP2 =(RTV COP2(OS)/RTV COP2)*100%; or % Diff from RTV COP29= (RTV COP29(OS)/RTV COP29)* 100% 0.00% 0.00% Optimal Portfolios (for risk free rates 2% p.a.) (2) Portfolio Weights Asset Classes 2% risk-free rate OPA OP1 OP2 1 US Large Cap 0.146638 0.000000 0.371371 . ---- 2 US Small Cap 0.000000 0.000000 0.000000 3 Global Equity - DM 0.000000 0.000000 0.000000 --------- 4 Global Equity - EM 0.000000 0.014808 0.000000 5 Commodities 0.000000 0.000000 0.000000 6 US Real Estate 0.000000 0.000000 0.034631 7 Cash 0.000000 0.000000 0.000000 8 US Treasury Bonds 0.615355 0.667356 0.553886 9 US IG Corp Bonds 0.000000 0.000000 0.000000 10 US HY Corp Bonds 0.238007 0.317836 0.040112 11 Global HY Corp Bonds 0.000000 0.000000 0.000000 12 Global IG Corporate Bonds 0.000000 0.000000 0.000000 13 Global Treasury Bonds 0.000000 0.000000 0.000000 Portfolio's return 0.004970 0.005716 0.006614 Portfolio's Risk 0.011880 0.012477 0.016581 Portfolio's Performamce (R-T-V ratio) 0.278074 0.324563 0.298356 (3) Portfolio Weights (4) Portfolio Weights 3% risk-free rate 4% risk-free rate OPA3 OP13 OP23 OPA4 OP14 OP24 0.199392 0.000000 0.7907810.387015 0.000000 0.819965 0.000000 0.000000 0.000000 0.000000 0.000000 0.000000 0.000000 0.000000 0.000000 0.000000 0.000000 0.000000 --------- 0.000000 0.023528 0.000000 0.000000 0.029786 0.000000 0.000000 0.000000 0.000000 0.000000 0.000000 0.000000 0.000000 0.000000 0.209219 0.033340 0.000000 0.180035 0.000000 0.000000 0.000000 0.000000 0.000000 0.000000 0.521058 0.630367 0.000000 0.169345 0.543667 0.000000 0.000000 0.000000 0.000000 0.000000 0.000000 0.000000 0.279551 0.346105 0.000000 0.4103000.263204 0.000000 0.000000 0.000000 0.000000 0.000000 0.163343 0.000000 0.000000 0.000000 0.000000 0.000000 0.000000 0.000000 0.000000 0.000000 0.000000 0.000000 0.000000 0.000000 0.005516 0.005922 0.0128680.007661 0.006448 0.012979 Expected Return 0.014169 0.013192 0.039349 0.026177 0.026177 0.039788 Std Dev 0.212841 0.259381 0.263499 0.165310 0.199840 0.242433 The Navely Diversified Portfolio (for risk-free rate of 2% per annum) (2) Portfolio Weights Asset Classes 2% risk-free rate EQA EQ1 EQ2 Portfolio's return 0.005682 0.006825 0.004539 Portfolio's Risk 0.026139 0.030242 0.021339 Portfolio's Performamce (R-T-V ratio) 0.153610 0.170556 0.134615 Template 4 Optimal Portfolios With Constraints (5) Portfolio Weights (6) Portfolio Weights Asset Classes 2% risk-free rate; Investment limits 2% risk-free rate; E(rp) = 9%p.a. COPA COD COP1 COP2 OPAS OP19 OP29 1 US Large Cap 0.244351 0.000000 0.495423 0.374236 0.000000 0.438142 2 US Small Cap 0.000000 0.000000 0.000000 0.000000 0.000000 0.000000 3 Global Equity - DM 0.000000 0.000000 0.000000 0.000000 0.000000 0.000000 4 Global Equity - EM 0.000000 0.049963 0.000000 0.000000 0.025680 0.000000 5 Commodities 0.000000 0.000000 0.000000 0.000000 0.000000 0.000000 6 US Real Estate 0.000000 0.010694 0.079724 0.028351 0.000000 0.063890 7 Cash 0.020000 0.050000 0.020000 0.000000 0.000000 0.000000 8 US Treasury Bonds 0.200000 0.200000 0.200000 0.194131 0.370634 0.497968 9 US IG Corp Bonds 0.385650 0.245369 0.204854 0.000000 0.000000 0.000000 10 US HY Corp Bonds 0.100000 0.100000 0.000000 0.403282 0.000000 0.000000 11 Global HY Corp Bonds 0.050000 0.050000 0.000000 0.000000 0.603685 0.000000 12 Global IG Corporate Bonds 0.000000 0.000000 0.000000 0.000000 0.000000 0.000000 13 Global Treasury Bonds 0.000000 0.293975 0.000000 0.000000 0.000000 0.000000 Portfolio's return 0.005847 0.005833 0.008687 0.007500 0.0075000.007500 Portfolio's Risk 0.017401 0.016208 0.024170 0.025208 0.021390 0.019610 Portfolio's Performamce (R-T-V ratio) 0.240211 0.257046 0.290461 0.231408 0.231408 0.272709 0.2727090.297470 figure 1 2% risk free with 9% pa (7) Portfolio Weights 2% risk-free rate; E(rp) =9%; Investment limits COPAS COP19 COP29 0.457969 0.000000 0.406820 0.000000 0.000000 0.000000 0.000000 0.000000 0.000000 0.000000 0.179430 0.000000 0.000000 0.000000 0.000000 0.066958 0.085654 0.029399 0.020000 0.020000 0.020000 0.200000 0.200000 0.200000 0.105073 0.023001 0.343781 0.100000 0.100000 0.000000 0.050000 0.050000 0.000000 0.000000 0.000000 0.000000 0.000000 0.341915 0.000000 0.007500 0.007500 0.007500 0.026082 0.025080 0.020206 0.223658 0.232591 0.288697 both combine Expected Return Std Dev Template 5 Out-of-the-sample Tests Optimal portfolios in subperiod 2 (8) Using optimal weights from subperiodi in subperiod 2 COP2 (OS) COP29 (OS) COP2 COP29 Portfolio's Return 0.008687 0.007500 Portfolio's Risk 0.024170 0.020206 Portfolio's RTV Ratio 0.290461 0.288697 % RTV Differrence from COP2 =(RTV COP2(OS)/RTV COP2)*100%; or % Diff from RTV COP29= (RTV COP29(OS)/RTV COP29)* 100% 0.00% 0.00%Step by Step Solution
There are 3 Steps involved in it
Step: 1

Get Instant Access to Expert-Tailored Solutions
See step-by-step solutions with expert insights and AI powered tools for academic success
Step: 2

Step: 3

Ace Your Homework with AI
Get the answers you need in no time with our AI-driven, step-by-step assistance
Get Started


