

Answered step by step
Verified Expert Solution
Question
1 Approved Answer
The circle graph shows the percent of people in a certain country with the various types of blood. If one person from this country
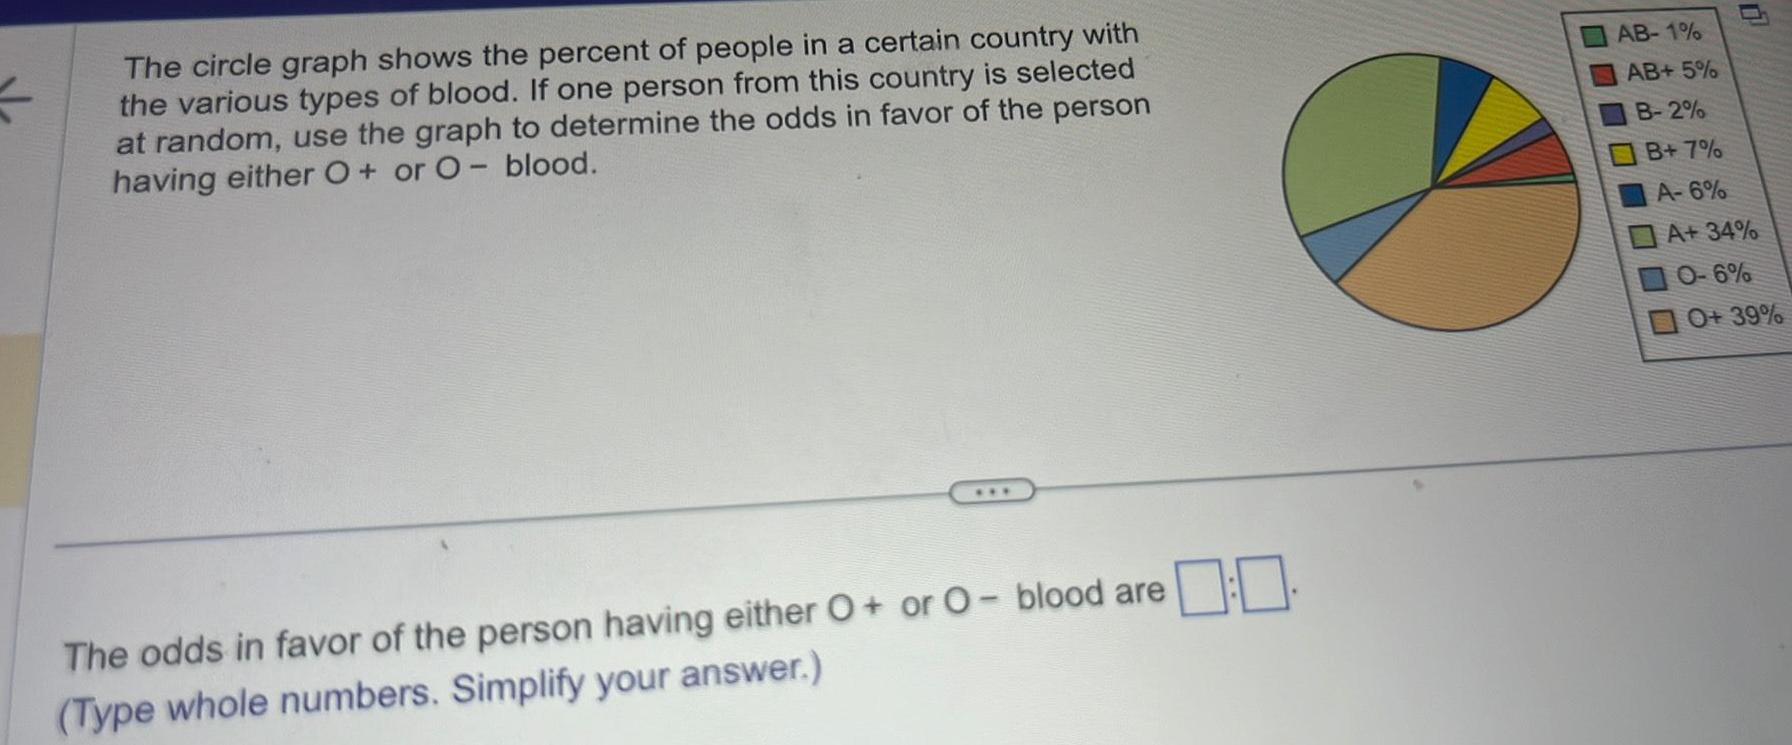
The circle graph shows the percent of people in a certain country with the various types of blood. If one person from this country is selected at random, use the graph to determine the odds in favor of the person having either O+ or O- blood. AB-1% AB+ 5% The odds in favor of the person having either O+ or O- blood are (Type whole numbers. Simplify your answer.) B-2% B+7% A-6% A+ 34% 0-6% 0+ 39%
Step by Step Solution
There are 3 Steps involved in it
Step: 1

Get Instant Access to Expert-Tailored Solutions
See step-by-step solutions with expert insights and AI powered tools for academic success
Step: 2

Step: 3
Ace Your Homework with AI
Get the answers you need in no time with our AI-driven, step-by-step assistance
Get Started
Advanced Engineering Mathematics
Authors: A. Ramakrishna Prasad
1st Edition
8126543876, 978-8126543878