

Answered step by step
Verified Expert Solution
Question
1 Approved Answer
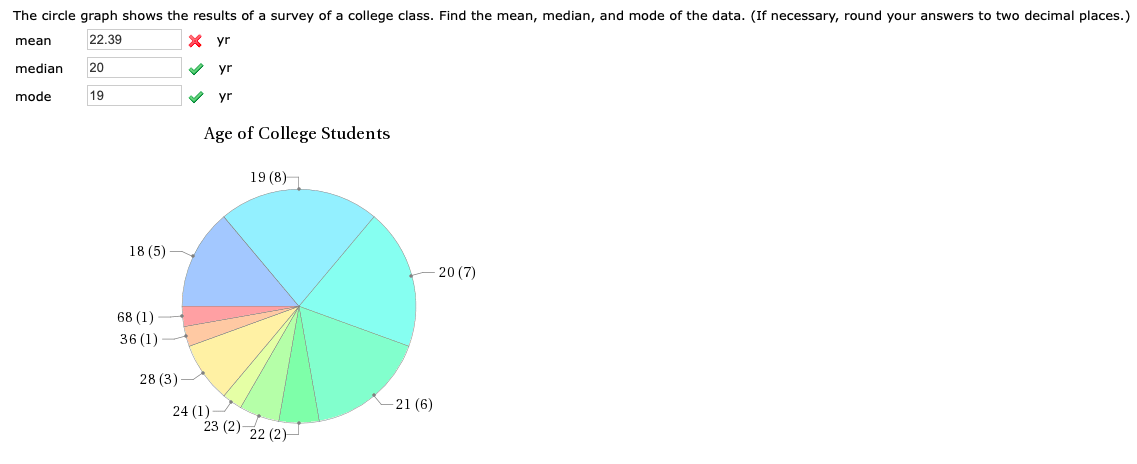
The circle graph shows the results of a survey of a college class. Find the mean, median, and mode of the data. (If necessary, round
Step by Step Solution
There are 3 Steps involved in it
Step: 1

Get Instant Access to Expert-Tailored Solutions
See step-by-step solutions with expert insights and AI powered tools for academic success
Step: 2

Step: 3
Ace Your Homework with AI
Get the answers you need in no time with our AI-driven, step-by-step assistance
Get Started
Global Analysis On Foliated Spaces
Authors: Calvin C Moore ,Claude L Schochet
2nd Edition
0521613051, 978-0521613057