

Answered step by step
Verified Expert Solution
Question
1 Approved Answer
I The class levels of a simple random sample of students are as folioas. The abbreviations B, AD, D. F stand for Bachelor, Advance
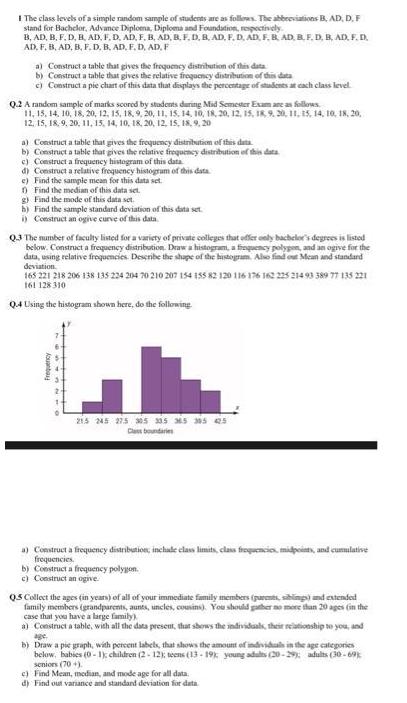
I The class levels of a simple random sample of students are as folioas. The abbreviations B, AD, D. F stand for Bachelor, Advance Diploema, Diploma and Foundation, repectively. B, AD, B, F. D, H, AD, F, D. AD, F, B, AD, B. F. D, B, AD, F. D, AD, F. R AD, BF. D, B, AD, F. D. AD, F. B. AD, B, F. D. B. AD, F, D, AD, F b) Construct a table that gives the relative froquency distribution of this data c) Construct a pie chart of this data that displays the percentage of students at cach class level Q2 A random sample of marks scored by students during Mid Semester Exam ane as follows 11, 15, 14. 10, 18, 20, 12, 15, 18,9, 20, 11, 15. 14, 10, 18, 20, 12. i5, IR 9. 20, 11, 15, 14, 10, 18, 20, 12, 15, 18, 9, 20, 11, 15, 14, 10, 18, 20, 12. 15, 18, 9, 20 a) Construct a table that gives the frequency distributiom of this data b) Construct a table that gives the relative frequeney distribution ef this data c) Construct a frequency histogram of this data di Construct a relative frequency histogrum of this data e) Find the sample mean for this data set. O Find the median of this data set. g) Find the mode of this data set. b) Find the sample standard deviation of this data set. i) Construct an ogive curve of this data. Q3 The number of faculty listed for a variety of private colleges that offer only bachelor's degrees is listed below. Construct a frequency distribution. Draw a histogram, a finquency polypon, and an ogive for the data, using relative frequencies. Deseribe the shape of the histogram Also find o Mean and standard deviation. 165 221 218 206 138 135 224 204 70 210 207 154 155 82 120 116 176 162 225 214 93 389 77 135 221 161 128 310 Q4 Using the histogram shown here, do the following 215 15 275 35 a5 M5 305 es Clas boundaries a) Construct a frequency distribution, inchade clas limits, clas froquemcios midpoints, and cummilative froquencies. b) Construct a frequency polygon. c) Construct an ogive. 05 Collect the ages fin years) of all of your immediate family members (purent, sibing) and extended family members (grandparents, aunts, uncles, cousimi). You shouid pather no mere than 20 ages (in the case that you have a large family) a) Conistruct a table, with all the data present, that shows the individals, their relationship to you, and age b) Draw a pie graph, with percent labels, that shows the amount of individualh in the age categories below, babies (0 -Ik children (2- 12 teens (13 - 19 young adults (20-29 adults (30- 69 seniors (70 +). e) Find Mean, median, and mode age for all data. d) Find out variance and standand deviation for data. Aouanta
Step by Step Solution
★★★★★
3.54 Rating (164 Votes )
There are 3 Steps involved in it
Step: 1
Step 1 Since you have asked multiple questions we will solve the first question for you If you want any specific question to be solved then please specify the question number or post only that questio...
Get Instant Access to Expert-Tailored Solutions
See step-by-step solutions with expert insights and AI powered tools for academic success
Step: 2

Step: 3
Ace Your Homework with AI
Get the answers you need in no time with our AI-driven, step-by-step assistance
Get Started
Elementary Statistics
Authors: Mario F. Triola
12th Edition
0321836960, 978-0321836960