Answered step by step
Verified Expert Solution
Question
1 Approved Answer
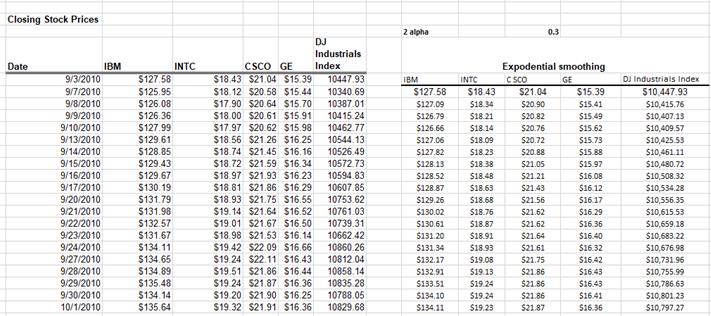
The Closing Stock Prices data below provides data for four stocks and the Dow Jones Industrial Average over a one-month period. 1. Construct a


The Closing Stock Prices data below provides data for four stocks and the Dow Jones Industrial Average over a one-month period. 1. Construct a visual of your choice to display all four stocks prices and the DJIA for each day over the period from 9/3/2010 to 10/1/2010. Be sure each stock/index is clearly identifiable. 2. Develop a spreadsheet model for forecasting each of the stock prices using simple exponential smoothing with a smoothing constant of 0.3. 3. Compare your results to the output from Excel's Data Analysis tool. 4. Compute MAD, MSE, and MAPE. 5. Does a smoothing constant of 0.1 or 0.5 yield better results? Closing Stock Prices Date DJ 2 alpha 0.3 IBM INTC 9/3/2010 $127.58 9/7/2010 $125.95 CSCO GE $18.43 $21.04 $15.39 $18.12 $20.58 $15.44 Industrials Index Expodential smoothing 10447.93 IBM INTC CSCO GE DJ Industrials Index 10340.69 $127.58 $18.43 $21.04 $15.39 $10,447.93 9/8/2010 $126.08 $17.90 $20.64 $15.70 10387.01 $127.09 $18.34 $20.90 $15.41 $10,415.76 9/9/2010 $126.36 $18.00 $20.61 $15.91 10415.24 $126.79 $18.21 $20.82 $15.49 $10,407.13 9/10/2010 $127.99 $17.97 $20.62 $15.98 10462.77 $126.66 $18.14 $20.76 $15.62 $10,409.57 9/13/2010 $129.61 $18.56 $21.26 $16.25 10544.13 $127.06 $18.09 $20.72 $15.73 $10,425.53 9/14/2010 $128.85 $18.74 $21.45 $16.16 10526.49 $127.82 $18.23 $20.88 $15.88 $10,461.11 9/15/2010 $129.43 $18.72 $21.59 $16.34 10572.73 $128.13 $18.38 $21.05 $15.97 $10,480.72 9/16/2010 9/17/2010 $129.67 $18.97 $21.93 $16.23 10594.83 $128.52 $18.48 $21.21 $16.08 $10,508.32 $130.19 $18.81 $21.86 $16.29 10607.85 $128.87 $18.63 $21.43 $16.12 $10,534.28 9/20/2010 $131.79 $18.93 $21.75 $16.55 10753.62 $129.26 $18.68 $21.56 $16.17 $10,556.35 9/21/2010 $131.98 $19.14 $21.64 $16.52 10761.03 $130.02 $18.76 $21.62 $16.29 $10,615.53 9/22/2010 $132.57 $19.01 $21.67 $16.50 10739.31 $130.61 $18.87 $21.62 $16.36 $10,659.18 9/23/2010 $131.67 $18.98 $21.53 $16.14 10662.42 $131.20 $18.91 $21.64 $16.40 $10,683.22 9/24/2010 $134.11 $19.42 $22.09 $16.66 10860.26 $131.34 $18.93 $21.61 $16.32 $10,676.98 9/27/2010 $134.65 $19.24 $22.11 $16.43 10812.04 $132.17 $19.08 $21.75 $16.42 $10,731.96 9/28/2010 $134.89 $19.51 $21.86 $16.44 10858.14 $132.91 $19.13 $21.86 $16.43 $10,755.99 9/29/2010 $135.48 $19.24 $21.87 $16.36 10835.28 $133.51 $19.24 $21.86 $16.43 $10,786.63 9/30/2010 $134.14 $19.20 $21.90 $16.25 10788.05 $134.10 $19.24 $21.86 $16.41 $10,801.23 10/1/2010 $135.64 $19.32 $21.91 $16.36 10829.68 $134.11 $19.23 $21.87 $16.36 $10,797.27
Step by Step Solution
There are 3 Steps involved in it
Step: 1
Analyzing Stock Prices and Forecasting with Simple Exponential Smoothing 1 Visualizing Stock Prices and DJIA Here are two options to visualize the dat...
Get Instant Access to Expert-Tailored Solutions
See step-by-step solutions with expert insights and AI powered tools for academic success
Step: 2

Step: 3

Ace Your Homework with AI
Get the answers you need in no time with our AI-driven, step-by-step assistance
Get Started


