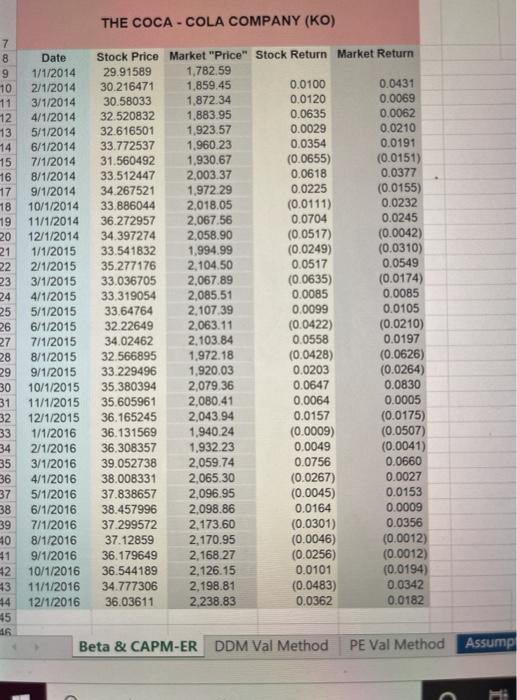
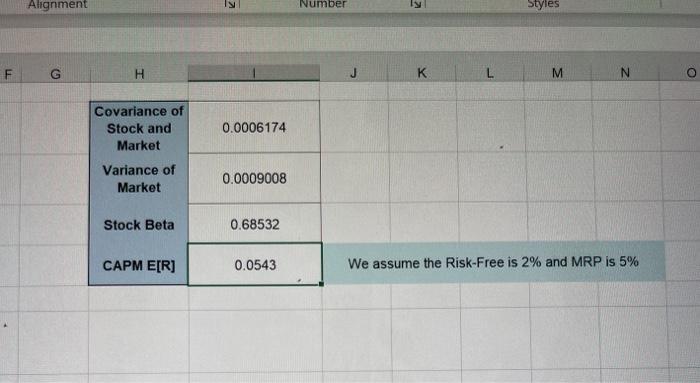
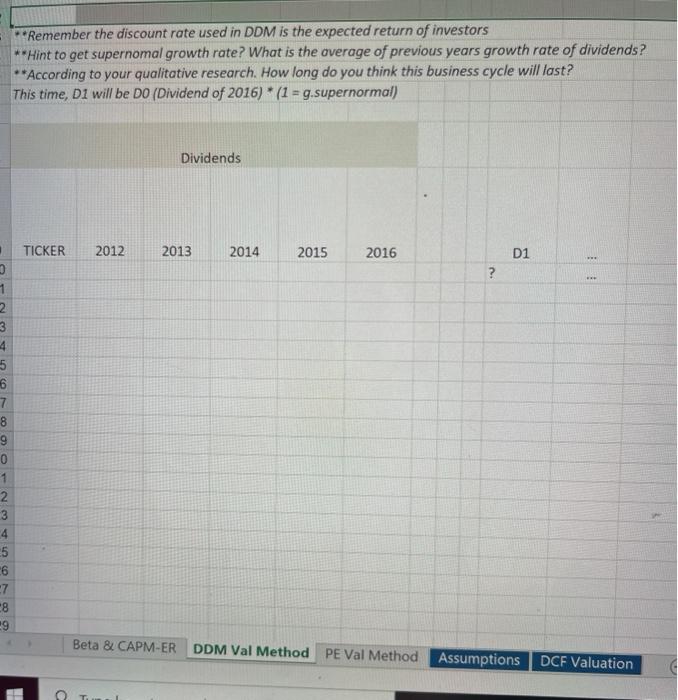
THE COCA-COLA COMPANY (KO) 7 8 9 10 11 12 13 14 15 16 17 18 19 20 21 22 23 24 25 26 27 28 29 30 31 32 33 34 35 36 37 38 39 40 41 42 13 44 15 16 Date 1/1/2014 2/1/2014 3/1/2014 4/1/2014 5/1/2014 6/1/2014 7/1/2014 8/1/2014 9/1/2014 10/1/2014 11/1/2014 12/1/2014 1/1/2015 2/1/2015 3/1/2015 4/1/2015 5/1/2015 6/1/2015 7/1/2015 8/1/2015 9/1/2015 10/1/2015 11/1/2015 12/1/2015 1/1/2016 2/1/2016 3/1/2016 4/1/2016 5/1/2016 6/1/2016 7/1/2016 8/1/2016 9/1/2016 10/1/2016 11/1/2016 12/1/2016 Stock Price Market "Price" Stock Return Market Return 29.91589 1,782.59 30.216471 1,859.45 0.0100 0.0431 30.58033 1.872.34 0.0120 0.0069 32.520832 1,883.95 0.0635 0.0062 32.616501 1.923.57 0.0029 0.0210 33.772537 1,960 23 0.0354 0.0191 31.560492 1,930.67 (0.0655) (0.0151) 33.512447 2.003.37 0.0618 0.0377 34.267521 1,972 29 0.0225 (0.0155) 33 886044 2,018.05 (0.0111) 0.0232 36.272957 2,067.56 0.0704 0.0245 34.397274 2,058.90 (0.0517) (0.0042) 33.541832 1,994.99 (0.0249) (0.0310) 35.277176 2,104.50 0.0517 0.0549 33.036705 2,067.89 (0.0635) (0.0174) 33.319054 2,085.51 0.0085 0.0085 33.64764 2,107 39 0.0099 0.0105 32.22649 2,063.11 (0.0422) (0.0210) 34.02462 2.103.84 0.0558 0.0197 32.566895 1.972.18 (0.0428) (0.0626) 33.229496 1,920.03 0.0203 (0.0264) 35.380394 2,079.36 0.0647 0.0830 35.605961 2,080.41 0.0064 0.0005 36.165245 2,043.94 0.0157 (0.0175) 36.131569 1.940.24 (0.0009) (0.0507) 36.308357 1,932 23 0.0049 (0.0041) 39.052738 2,059.74 0.0756 0.0660 38.008331 2,065.30 (0.0267) 0.0027 37.838657 2,096.95 (0.0045) 0.0153 38.457996 2,098.86 0.0164 0.0009 37.299572 2,173.60 (0.0301) 0.0356 37.12859 2,170.95 (0.0046) (0.0012) 36.179649 2.168.27 (0.0256) (0.0012) 36.544189 2.126.15 0.0101 (0.0194) 34.777306 2.198.81 (0.0483) 0.0342 36.03611 2.238.83 0.0362 0.0182 Beta & CAPM-ER DDM Val Method PE Val Method Assump i Alignment IN Number Styles F G H K M Covariance of Stock and Market 0.0006174 Variance of Market 0.0009008 Stock Beta 0.68532 CAPM E[R] 0.0543 We assume the Risk-Free is 2% and MRP is 5% *Remember the discount rate used in DDM is the expected return of investors **Hint to get supernomal growth rate? What is the average of previous years growth rate of dividends ? **According to your qualitative research. How long do you think this business cycle will last? This time, Di will be DO (Dividend of 2016) * (1 = g.supernormal) Dividends TICKER 2012 2013 2014 2015 2016 D1 ? 3 1 2 3 4 5 6 7 8 9 0 1 2 3 5 6 7 CO 0 Beta & CAPM-ER DDM Val Method PE Val Method Assumptions DCF Valuation THE COCA-COLA COMPANY (KO) 7 8 9 10 11 12 13 14 15 16 17 18 19 20 21 22 23 24 25 26 27 28 29 30 31 32 33 34 35 36 37 38 39 40 41 42 13 44 15 16 Date 1/1/2014 2/1/2014 3/1/2014 4/1/2014 5/1/2014 6/1/2014 7/1/2014 8/1/2014 9/1/2014 10/1/2014 11/1/2014 12/1/2014 1/1/2015 2/1/2015 3/1/2015 4/1/2015 5/1/2015 6/1/2015 7/1/2015 8/1/2015 9/1/2015 10/1/2015 11/1/2015 12/1/2015 1/1/2016 2/1/2016 3/1/2016 4/1/2016 5/1/2016 6/1/2016 7/1/2016 8/1/2016 9/1/2016 10/1/2016 11/1/2016 12/1/2016 Stock Price Market "Price" Stock Return Market Return 29.91589 1,782.59 30.216471 1,859.45 0.0100 0.0431 30.58033 1.872.34 0.0120 0.0069 32.520832 1,883.95 0.0635 0.0062 32.616501 1.923.57 0.0029 0.0210 33.772537 1,960 23 0.0354 0.0191 31.560492 1,930.67 (0.0655) (0.0151) 33.512447 2.003.37 0.0618 0.0377 34.267521 1,972 29 0.0225 (0.0155) 33 886044 2,018.05 (0.0111) 0.0232 36.272957 2,067.56 0.0704 0.0245 34.397274 2,058.90 (0.0517) (0.0042) 33.541832 1,994.99 (0.0249) (0.0310) 35.277176 2,104.50 0.0517 0.0549 33.036705 2,067.89 (0.0635) (0.0174) 33.319054 2,085.51 0.0085 0.0085 33.64764 2,107 39 0.0099 0.0105 32.22649 2,063.11 (0.0422) (0.0210) 34.02462 2.103.84 0.0558 0.0197 32.566895 1.972.18 (0.0428) (0.0626) 33.229496 1,920.03 0.0203 (0.0264) 35.380394 2,079.36 0.0647 0.0830 35.605961 2,080.41 0.0064 0.0005 36.165245 2,043.94 0.0157 (0.0175) 36.131569 1.940.24 (0.0009) (0.0507) 36.308357 1,932 23 0.0049 (0.0041) 39.052738 2,059.74 0.0756 0.0660 38.008331 2,065.30 (0.0267) 0.0027 37.838657 2,096.95 (0.0045) 0.0153 38.457996 2,098.86 0.0164 0.0009 37.299572 2,173.60 (0.0301) 0.0356 37.12859 2,170.95 (0.0046) (0.0012) 36.179649 2.168.27 (0.0256) (0.0012) 36.544189 2.126.15 0.0101 (0.0194) 34.777306 2.198.81 (0.0483) 0.0342 36.03611 2.238.83 0.0362 0.0182 Beta & CAPM-ER DDM Val Method PE Val Method Assump i Alignment IN Number Styles F G H K M Covariance of Stock and Market 0.0006174 Variance of Market 0.0009008 Stock Beta 0.68532 CAPM E[R] 0.0543 We assume the Risk-Free is 2% and MRP is 5% *Remember the discount rate used in DDM is the expected return of investors **Hint to get supernomal growth rate? What is the average of previous years growth rate of dividends ? **According to your qualitative research. How long do you think this business cycle will last? This time, Di will be DO (Dividend of 2016) * (1 = g.supernormal) Dividends TICKER 2012 2013 2014 2015 2016 D1 ? 3 1 2 3 4 5 6 7 8 9 0 1 2 3 5 6 7 CO 0 Beta & CAPM-ER DDM Val Method PE Val Method Assumptions DCF Valuation


