Answered step by step
Verified Expert Solution
Question
1 Approved Answer
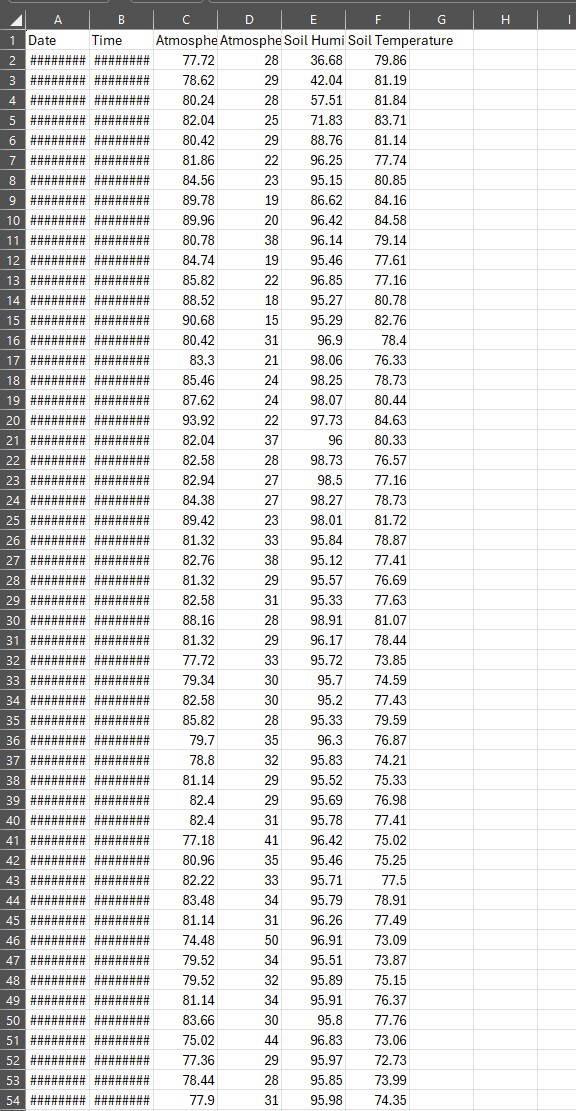
The code must be done in python, The information will be given in the picture shown. Thank you. #You will find the two data sets
The code must be done in python, The information will be given in the picture shown. Thank you.
#You will find the two data sets that have the highest correlation either negitive or positive and then plot the data using a scatter plot.
#Then using the seaborn library, plot the regression line of the data.
#Create a function to read each colmn of Atmosphere Temperature, Soil Temperature, Atmosphere Humidity and Soil Humidity using the values method from the numpy library.
#Pass the values to a second function that will calculate and display the correlation coefficient of the two highest correlation values to the console.
#Choose any correlation method you wish. Good examples can be found in the second resrouce listed above. there will be one negative and one positive correlation
#HINT: You may need to test different combinations to get the best correlations. ie Atm Hum vs Soil Hum, Atm Temp vs Soil Hum...etc.
#Pass the values to a third function that will display a scatter plots of the two data sets with a properly fit regression line.
#Label the plots with the appropriate title and label the xaxis and yaxis as well. Display the plots to the console and also include code to save the file to PlantCorr.pdf
#Create the main function which calls all three functions. Don't forget to call main to kick it off!
import pandas as pd
import numpy as np
from matplotlib import pyplot as plt
from scipy.stats import spearmanr as spr
import seaborn as sns
def readtovalues:
# Open the plantdata file for reading.
# Read all the lines from the file.
#### Fix Me ####
plantfile pdreadcsv
#create column value lists for plotting
atmtemp plantfileAtmosphere Temp'values
#### Fix Me ####
#### Fix Me ####
#### Fix Me ####
#### Fix Me ####
return
#### Fix Me ####
def corrcalc:
#correlation calculation
#### Fix Me ####
#### Fix Me ####
# Print the result
printfttCorrelation: result:tttCorrelation: result:
#### Fix Me ####
def plotme:
#plot the data points and regression lines for neg and pos correlation
#### Fix Me ####
plttightlayout
pltsavefigdriveMy DriveColab NotebooksNEWEST PlantCorr.pdf
pltshow
# Create the main function.
def main:
#### Fix Me ####
readtovalues
corrcalc
plotme
# Call main function to kick it off!
#### Fix Me ####

Step by Step Solution
There are 3 Steps involved in it
Step: 1

Get Instant Access to Expert-Tailored Solutions
See step-by-step solutions with expert insights and AI powered tools for academic success
Step: 2

Step: 3

Ace Your Homework with AI
Get the answers you need in no time with our AI-driven, step-by-step assistance
Get Started


