Answered step by step
Verified Expert Solution
Question
1 Approved Answer
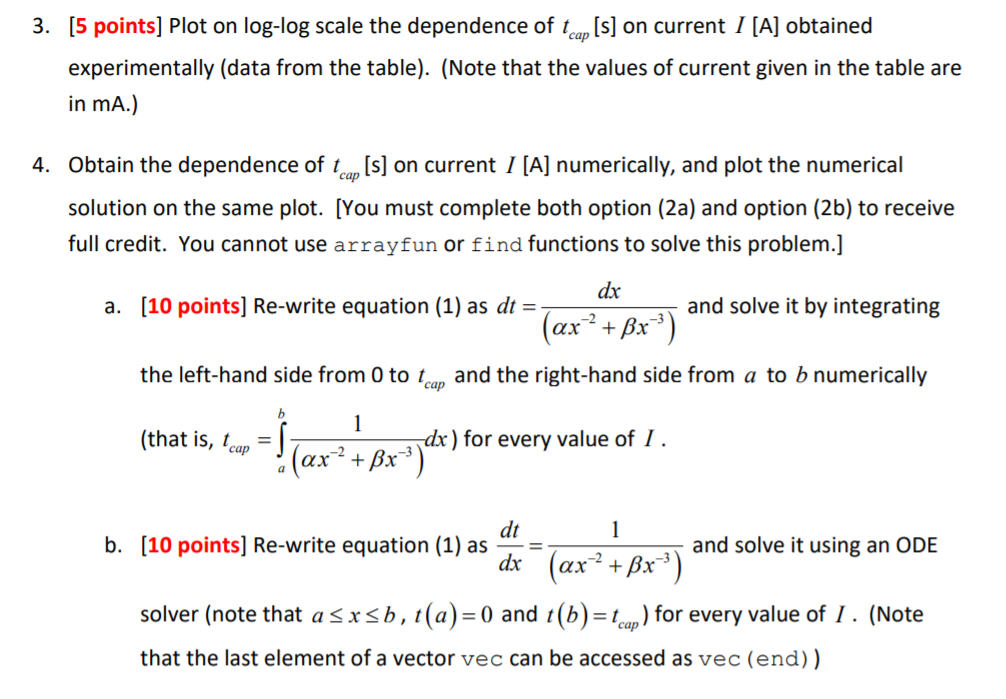
The code needs to be performed on MATLAB. 3. [5 points] Plot on log-log scale the dependence ofts] on current / [A] obtained cap experimentally


The code needs to be performed on MATLAB.
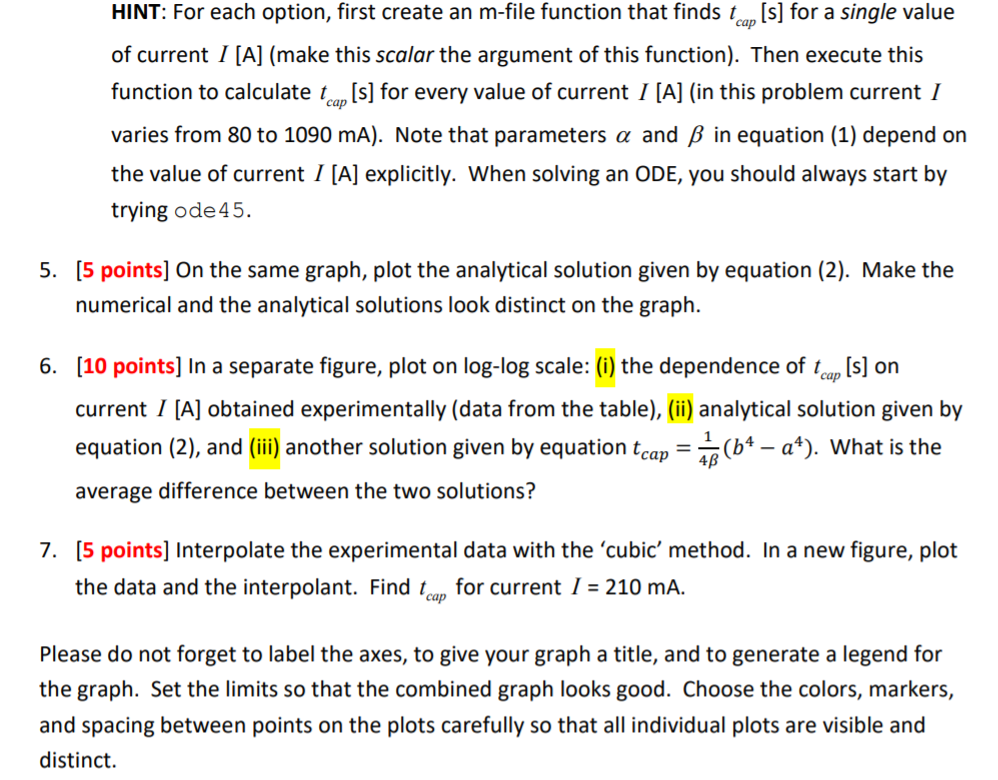
3. [5 points] Plot on log-log scale the dependence ofts] on current / [A] obtained cap experimentally (data from the table). (Note that the values of current given in the table are in mA.) Obtain the dependence of tcp[s] on current/ [A] numerically, and plot the numerical solution on the same plot. [You must complete both option (2a) and option (2b) to receive full credit. You cannot use arrayfun or find functions to solve this problem.] 4. dr a. [10 points] Re-write equation (1) as dt - ad solve it by integrating the left-hand side from 0 to tcap and the right-hand side from a to b numerically (that is, lcap2 tRr-3 ) for every value of dt dx b. [10 points] Re-write equation (1) as- and solve it using an ODE solver (note that a x b , t (a)-0 and 1 (b)-wp ) for every value of 1 . (Note that the last element of a vector vec can be accessed as vec (end)) cap HINT: For each option, first create an m-file function that finds t[s] for a single value of current I [A] (make this scalar the argument of this function). Then execute this function to calculate (oup[s] for every value of current / [A] (in this problem current varies from 80 to 1090 mA). Note that parameters and in equation (1) depend on the value of current I [A] explicitly. When solving an ODE, you should always start by trying ode45 [5 points] On the same graph, plot the analytical solution given by equation (2). Make the numerical and the analytical solutions look distinct on the graph. 5. 6. [10 points] In a separate figure, plot on log-log scale: (i) the dependence of tcan [s] on current / [A] obtained experimentally (data from the table), (ii) analytical solution given by equation (2), and (iii) another solution given by equation tcap-4(N-a') what is the average difference between the two solutions? [5 points] Interpolate the experimental data with the 'cubic' method. In a new figure, plot the data and the interpolant. Find (oap for current I 210 mA. 7. Please do not forget to label the axes, to give your graph a title, and to generate a legend for the graph. Set the limits so that the combined graph looks good. Choose the colors, markers, and spacing between points on the plots carefully so that all individual plots are visible and distinct. 3. [5 points] Plot on log-log scale the dependence ofts] on current / [A] obtained cap experimentally (data from the table). (Note that the values of current given in the table are in mA.) Obtain the dependence of tcp[s] on current/ [A] numerically, and plot the numerical solution on the same plot. [You must complete both option (2a) and option (2b) to receive full credit. You cannot use arrayfun or find functions to solve this problem.] 4. dr a. [10 points] Re-write equation (1) as dt - ad solve it by integrating the left-hand side from 0 to tcap and the right-hand side from a to b numerically (that is, lcap2 tRr-3 ) for every value of dt dx b. [10 points] Re-write equation (1) as- and solve it using an ODE solver (note that a x b , t (a)-0 and 1 (b)-wp ) for every value of 1 . (Note that the last element of a vector vec can be accessed as vec (end)) cap HINT: For each option, first create an m-file function that finds t[s] for a single value of current I [A] (make this scalar the argument of this function). Then execute this function to calculate (oup[s] for every value of current / [A] (in this problem current varies from 80 to 1090 mA). Note that parameters and in equation (1) depend on the value of current I [A] explicitly. When solving an ODE, you should always start by trying ode45 [5 points] On the same graph, plot the analytical solution given by equation (2). Make the numerical and the analytical solutions look distinct on the graph. 5. 6. [10 points] In a separate figure, plot on log-log scale: (i) the dependence of tcan [s] on current / [A] obtained experimentally (data from the table), (ii) analytical solution given by equation (2), and (iii) another solution given by equation tcap-4(N-a') what is the average difference between the two solutions? [5 points] Interpolate the experimental data with the 'cubic' method. In a new figure, plot the data and the interpolant. Find (oap for current I 210 mA. 7. Please do not forget to label the axes, to give your graph a title, and to generate a legend for the graph. Set the limits so that the combined graph looks good. Choose the colors, markers, and spacing between points on the plots carefully so that all individual plots are visible and distinct
Step by Step Solution
There are 3 Steps involved in it
Step: 1

Get Instant Access to Expert-Tailored Solutions
See step-by-step solutions with expert insights and AI powered tools for academic success
Step: 2

Step: 3

Ace Your Homework with AI
Get the answers you need in no time with our AI-driven, step-by-step assistance
Get Started


