

Answered step by step
Verified Expert Solution
Question
1 Approved Answer
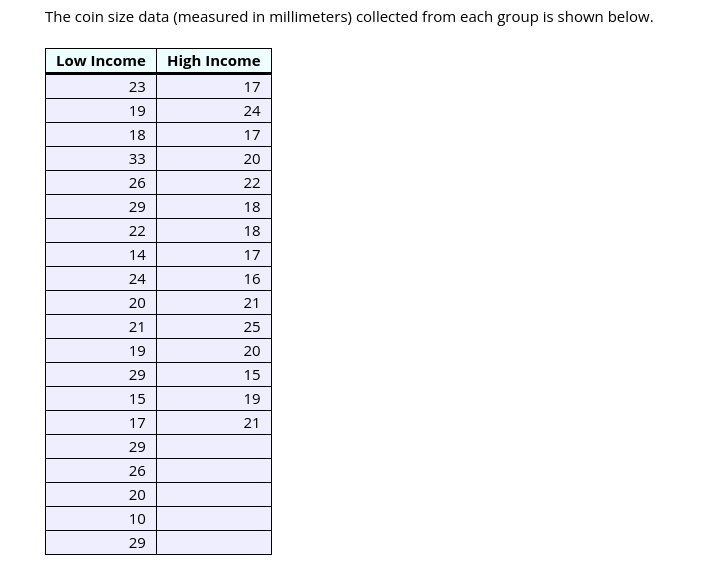
The coin size data (measured in millimeters) collected from each group is shown below. Low Income High Income 23 17 19 24 18 17 33
Step by Step Solution
There are 3 Steps involved in it
Step: 1

Get Instant Access to Expert-Tailored Solutions
See step-by-step solutions with expert insights and AI powered tools for academic success
Step: 2

Step: 3
Ace Your Homework with AI
Get the answers you need in no time with our AI-driven, step-by-step assistance
Get Started
Calculus Early Transcendentals, Multivariable
Authors: Michael Sullivan, Kathleen Miranda
2nd Edition
131924288X, 9781319242886