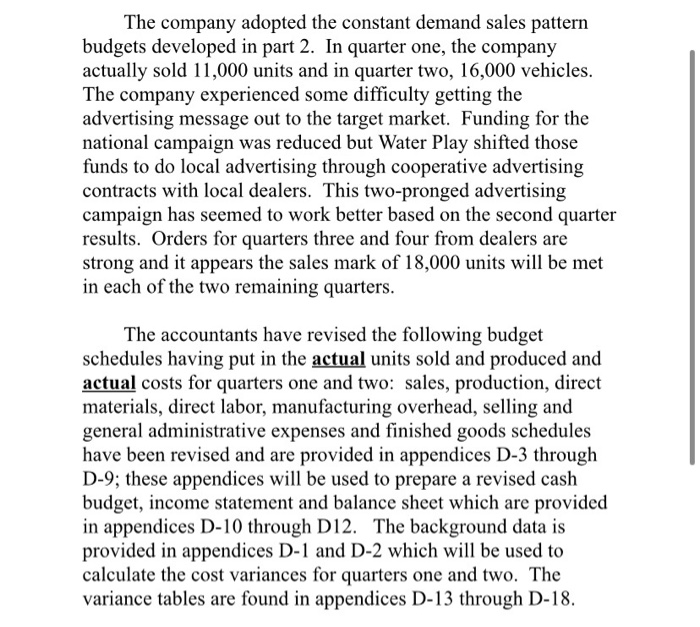
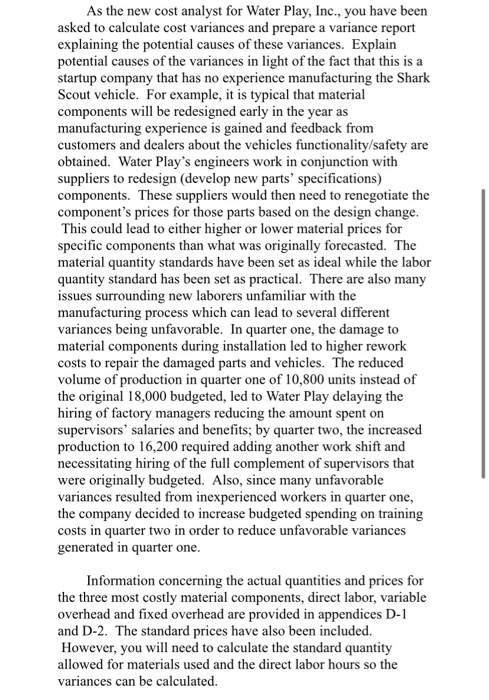
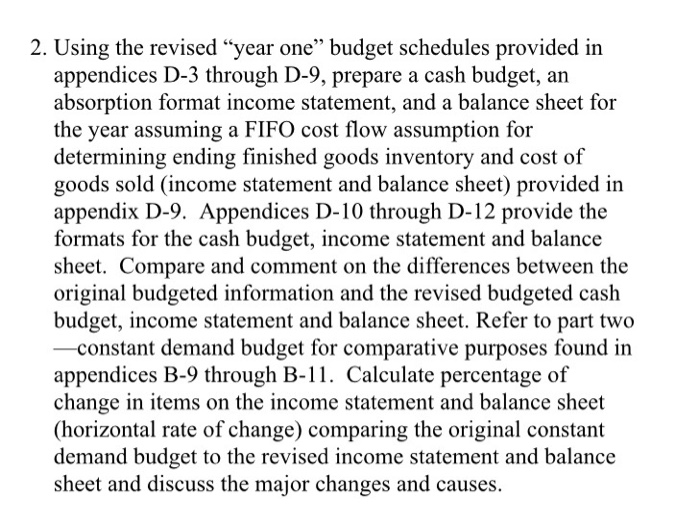
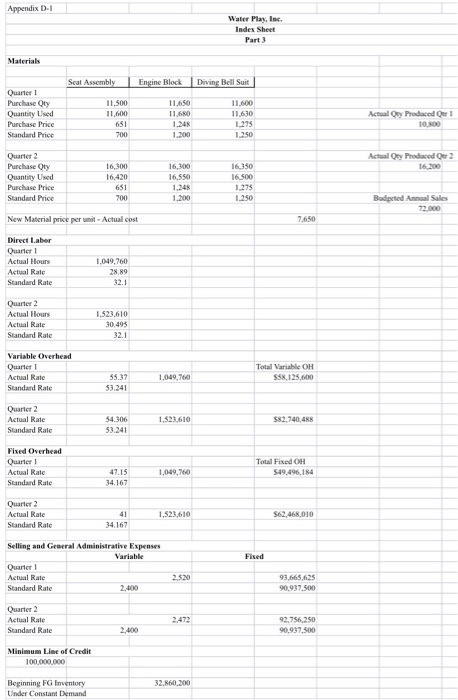
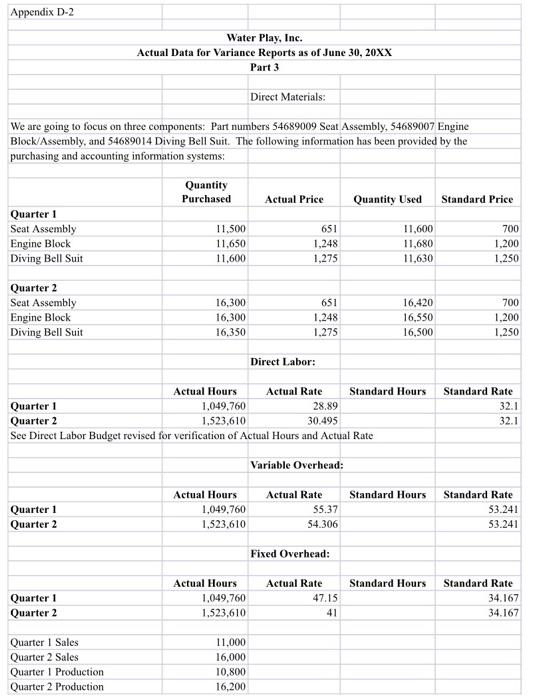
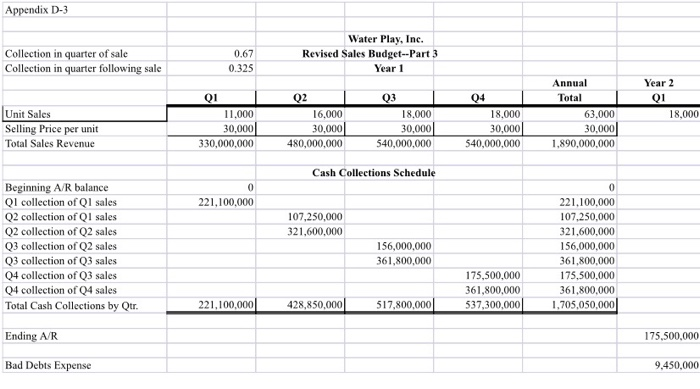
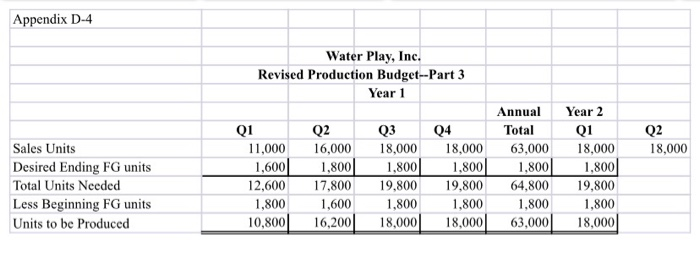
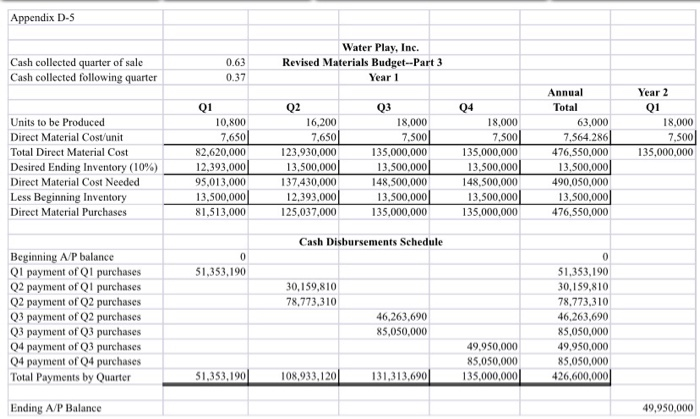
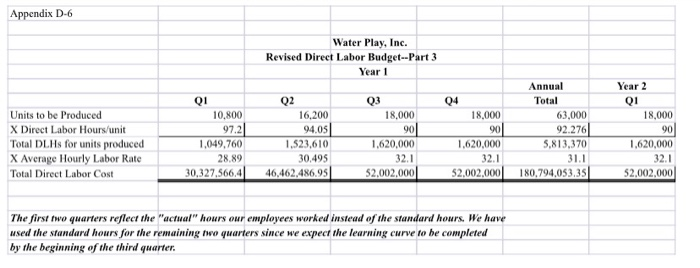
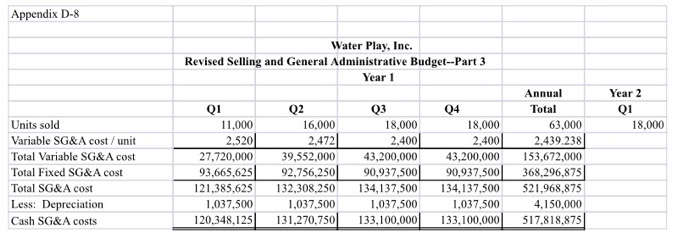
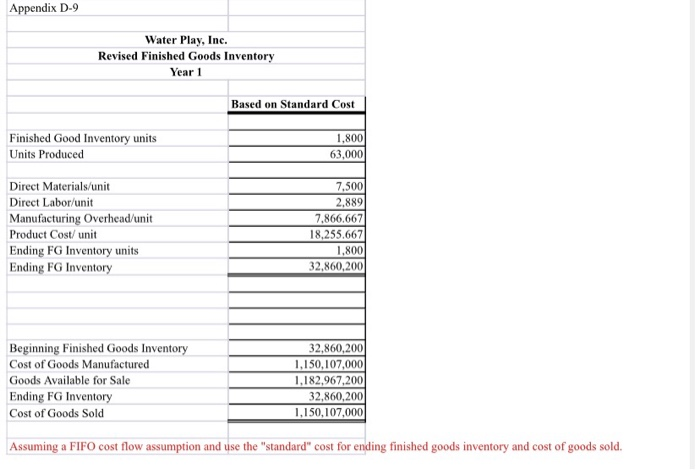
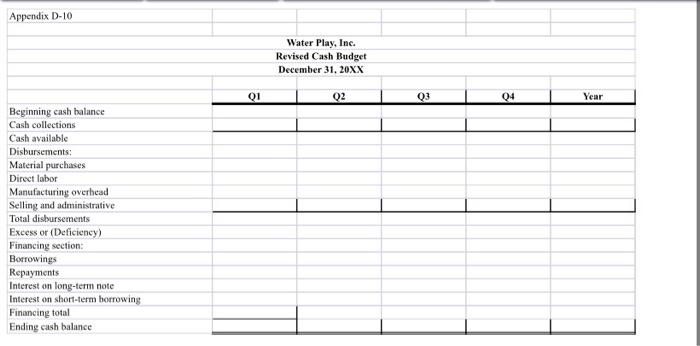
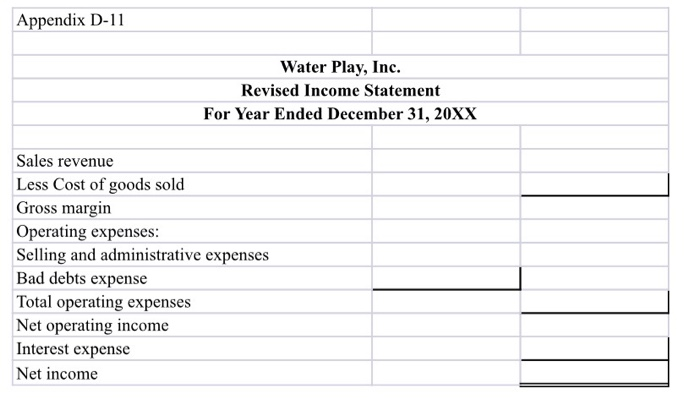
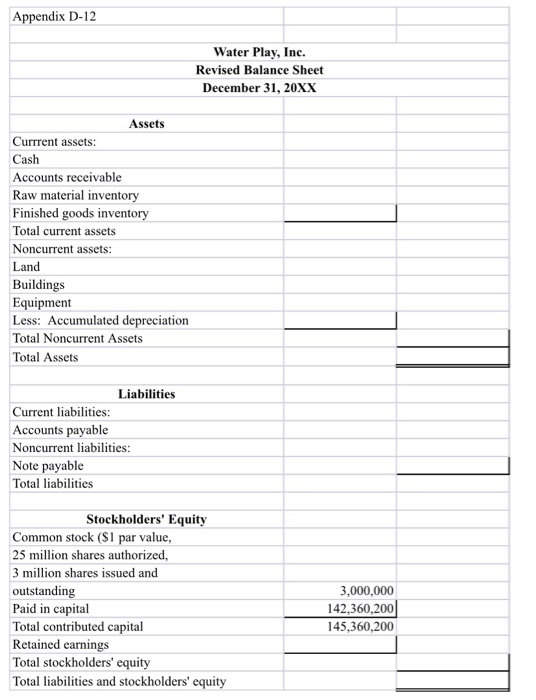
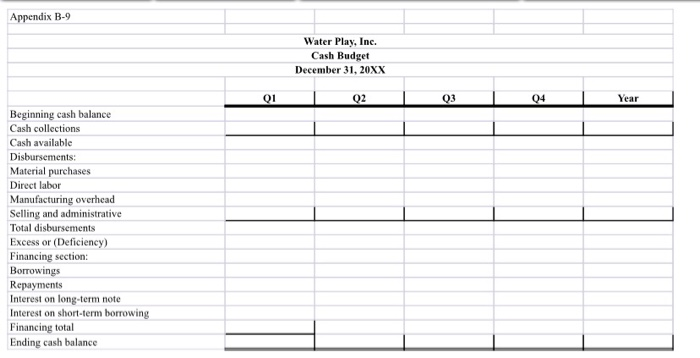
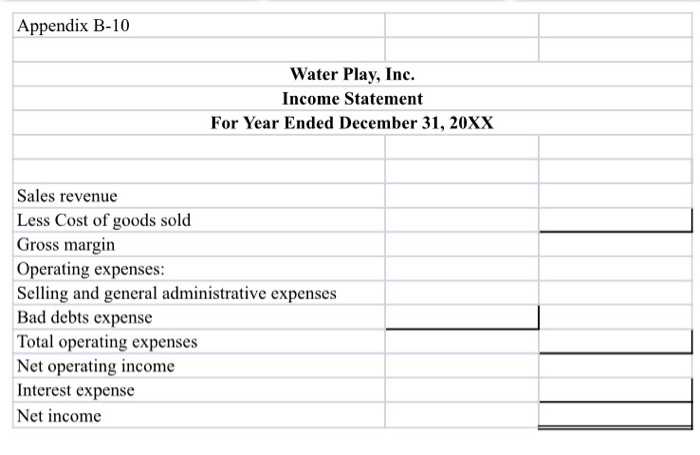
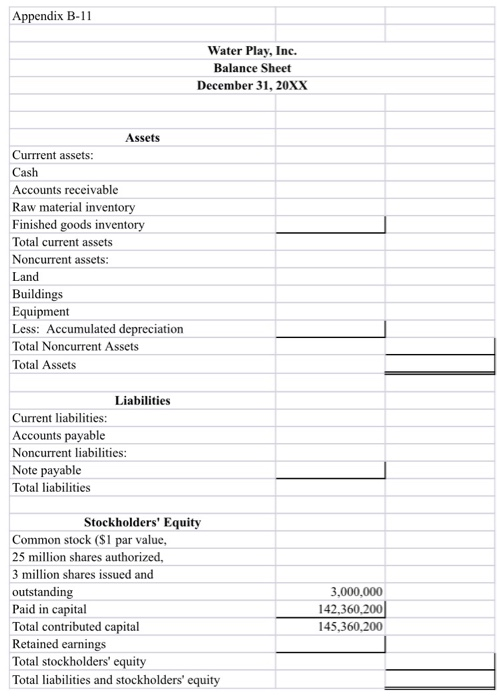
The company adopted the constant demand sales pattern budgets developed in part 2. In quarter one, the company actually sold 11,000 units and in quarter two, 16,000 vehicles. The company experienced some difficulty getting the advertising message out to the target market. Funding for the national campaign was reduced but Water Play shifted those funds to do local advertising through cooperative advertising contracts with local dealers. This two-pronged advertising campaign has seemed to work better based on the second quarter results. Orders for quarters three and four from dealers are strong and it appears the sales mark of 18,000 units will be met in each of the two remaining quarters. The accountants have revised the following budget schedules having put in the actual units sold and produced and actual costs for quarters one and two: sales, production, direct materials, direct labor, manufacturing overhead, selling and general administrative expenses and finished goods schedules have been revised and are provided in appendices D-3 through D-9; these appendices will be used to prepare a revised cash budget, income statement and balance sheet which are provided in appendices D-10 through D12. The background data is provided in appendices D-1 and D-2 which will be used to calculate the cost variances for quarters one and two. The variance tables are found in appendices D-13 through D-18. As the new cost analyst for Water Play, Inc., you have been asked to calculate cost variances and prepare a variance report explaining the potential causes of these variances. Explain potential causes of the variances in light of the fact that this is a startup company that has no experience manufacturing the Shark Scout vehicle. For example, it is typical that material components will be redesigned early in the year as manufacturing experience is gained and feedback from customers and dealers about the vehicles functionality/safety are obtained. Water Play's engineers work in conjunction with suppliers to redesign (develop new parts' specifications) components. These suppliers would then need to renegotiate the component's prices for those parts based on the design change. This could lead to either higher or lower material prices for specific components than what was originally forecasted. The material quantity standards have been set as ideal while the labor quantity standard has been set as practical. There are also many issues surrounding new laborers unfamiliar with the manufacturing process which can lead to several different variances being unfavorable. In quarter one, the damage to material components during installation led to higher rework costs to repair the damaged parts and vehicles. The reduced volume of production in quarter one of 10,800 units instead of the original 18,000 budgeted, led to Water Play delaying the hiring of factory managers reducing the amount spent on supervisors' salaries and benefits; by quarter two, the increased production to 16,200 required adding another work shift and necessitating hiring of the full complement of supervisors that were originally budgeted. Also, since many unfavorable variances resulted from inexperienced workers in quarter one, the company decided to increase budgeted spending on training costs in quarter two in order to reduce unfavorable variances generated in quarter one. Information concerning the actual quantities and prices for the three most costly material components, direct labor, variable overhead and fixed overhead are provided in appendices D-1 and D-2. The standard prices have also been included. However, you will need to calculate the standard quantity allowed for materials used and the direct labor hours so the variances can be calculated. 2. Using the revised year one budget schedules provided in appendices D-3 through D-9, prepare a cash budget, an absorption format income statement, and a balance sheet for the year assuming a FIFO cost flow assumption for determining ending finished goods inventory and cost of goods sold (income statement and balance sheet) provided in appendix D-9. Appendices D-10 through D-12 provide the formats for the cash budget, income statement and balance sheet. Compare and comment on the differences between the original budgeted information and the revised budgeted cash budget, income statement and balance sheet. Refer to part two constant demand budget for comparative purposes found in appendices B-9 through B-11. Calculate percentage of change in items on the income statement and balance sheet (horizontal rate of change) comparing the original constant demand budget to the revised income statement and balance sheet and discuss the major changes and causes. Appendix D-1 Water Play, Inc. Index Sheet Materials Scat Assembly Engine Block Diving Bell Suit Quarter 1 Purchase Oly Quantity Used Purchase Price Standard Price 11.500 11,600 Actual Oy Produced Qer 11.650 11.680 1.248 1.200 11.600 11.630 1.275 1.250 Actual Oy Produced Oer 2 16.200 Quarter 2 Purchase ty Quantity Used Purchase Price Standard Price 16,300 16,420 16,300 16.550 1.248 1.200 16 350 16.500 1.275 1.250 651 Budited Annual Sales New Material price per unit - Actual cost Direct Laber Quarter Actual Hours Actual Rate Standard Rate 1.049,760 32.1 Quarter 2 Actual Hours Actual Rate Standard Rate 1.521,610 30.495 Variable Overhead Quarter 1 Actual Rate Standard Rate Total Variable OH $58,125,600 55.37 Quarter 2 Actual Rate Standard Rale 54 106 53.241 $82,740,488 Fixed Overhead Quarter 1 Actual Rate Standard Rate Total Fixed OH $49,496,184 47.15 34.167 Quarter 2 Actual Rate Standard Rate 1.523,610 $62.468,010 Selling and General Administrative Expenses Variable Quarter Actual Rate Standard Rate 93.665.625 Quarter 2 Actual Rale Standard Rate 92.756.250 90.937.500 Minimum Line of Credit 100.000.000 Reginning FG Inventory Under Constant Demand Appendix D-2 Water Play, Inc. Actual Data for Variance Reports as of June 30, 20XX Part 3 Direct Materials: We are going to focus on three components: Part numbers 54689009 Seat Assembly, 54689007 Engine Block/Assembly, and 54689014 Diving Bell Suit. The following information has been provided by the purchasing and accounting information systems: Quantity Purchased Actual Price Quantity Used Standard Price 700 Quarter 1 Seat Assembly Engine Block Diving Bell Suit 11.500 11.650 11,600 651 1,248 1.275 11,600 11,680 11,630 1,200 1,250 Quarter 2 Seat Assembly Engine Block Diving Bell Suit 16,300 16,300 16,350 651 1,248 1,275 16,420 16,550 16,500 700 1,200 1.250 Direct Labor: Standard Rate Actual Hours Actual Rate Standard Hours Quarter 1 1.049,760 28.89 Quarter 2 1,523,610 30.495 See Direct Labor Budget revised for verification of Actual Hours and Actual Rate Variable Overhead: Standard Hours Quarter 1 Quarter 2 Actual Hours 1,049,760 1,523,610 Actual Rate 55.37 54.306 Standard Rate 53.241 53.241 Fixed Overhead: Standard Hours Actual Hours 1.049,760 1,523,610 Actual Rate 47.15 Quarter 1 Quarter 2 Standard Rate 34.167 34.167 Quarter i Sales Quarter 2 Sales Quarter 1 Production Quarter 2 Production 11.000 16,000 10.800 16,200 Appendix D-3 Collection in quarter of sale Collection in quarter following sale 0.67 0.325 Water Play, Inc. Revised Sales Budget -- Part 3 Year 1 Annual Total Q1 11,000 30,000 330,000,000 Unit Sales Selling Price per unit Total Sales Revenue Q2 16.000 30,000 480,000,000 Q3 18.000 30,000 540,000,000 Year 2 Q1 18,000 Q4 18.000 30,000 540,000,000 63.000 30,000 1,890,000,000 Cash Collections Schedule 221,100,000 107,250,000 321,600,000 Beginning A/R balance Q1 collection of Ql sales Q2 collection of Q1 sales Q2 collection of Q2 sales Q3 collection of Q2 sales Q3 collection of Q3 sales Q4 collection of Q3 sales Q4 collection of 04 sales Total Cash Collections by Qtr. 156,000,000 361,800,000 221,100,000 107,250,000 321,600,000 156,000,000 361,800,000 175,500,000 361,800,000 1,705,050,000 175,500,000 361,800,000 537,300,000 221,100,000 428,850,000 517,800,000 Ending A/R 175,500,000 Bad Debts Expense 9,450,000 Appendix D-4 Water Play, Inc. Revised Production Budget--Part 3 Year 1 Q2 18,000 Sales Units Desired Ending FG units Total Units Needed Less Beginning FG units Units to be Produced 01 11,000 1,600 12,600 1,800 10,800 02 16,000 1,800| 17.800 1,600 16,200 Q3 18,000 1,800 19.800 1,800 18,000 Q4 18,000 1,800 19.800 1,800 18,000 Annual Total 63,000 1,800 64.800 1,800 63,000 Year 2 Q1 18,000 1.800 19.800 1,800 18,000 Appendix D-5 Cash collected quarter of sale Cash collected following quarter 0.63 0.37 Water Play, Inc. Revised Materials Budget--Part 3 Year 1 Year 2 Q1 18,000 7.500 1 35,000,000 Units to be Produced Direct Material Cost/unit Total Direct Material Cost Desired Ending Inventory (10%) Direct Material Cost Needed Less Beginning Inventory Direct Material Purchases Q1 10,800 7,6501 82,620,000 12,393.000 95,013,000 13,500,000 81,513,000 Q2 16,200 7,650 123.930,000 13,500,000 137,430,000 12.393,000 125.037.000 Q3 18,000 7,500 135,000,000 13,500,000 148,500,000 13,500,000 135,000,000 Annual Total 63,000 7.564.286 476,550,000 13,500,000 490,050,000 13,500,000 476,550,000 Q4 18,000 7,500 135.000.000 13,500,000 148,500,000 13.500.000 135.000.000 Cash Disbursements Schedule 51,353,190 30,159,810 78,773.310 Beginning A/P balance Q1 payment of QI purchases Q2 payment of QI purchases Q2 payment of Q2 purchases Q3 payment of Q2 purchases Q3 payment of Q3 purchases Q4 payment of Q3 purchases Q4 payment of Q4 purchases Total Payments by Quarter 46,263,690 85,050,000 0 51.353,190 30,159,810 78.773,310 46.263,690 85,050,000 49,950,000 85,050,000 426,600,000 49,950,000 85,050.000 135,000,000 31,353,190 108,933,120 131,313,690 Ending A/P Balance 49,950,000 Appendix D-6 Water Play, Inc. Revised Direct Labor Budget - Part 3 Year 1 Q3 04 Year 2 Q1 18.000 18,000 Units to be Produced X Direct Labor Hours/unit Total DLHs for units produced X Average Hourly Labor Rate Total Direct Labor Cost 90 01 10.800 97.21 1.049,760 28.89 30,327,566, 4 02 16,200 94.05 1.523.610 30.495 4 6,462,486,95 Annual Total 63,000 92.2761 5,813,370 31.1 180,794,053,35 18.000 901 1.620,000 32.1 52,002,000 1.620,000 32.1 1.620,000 32.1 52.002,000 52,002.000 The first two quarters reflect the "actual" hours our employees worked instead of the standard hours. We have used the standard hours for the remaining two quarters since we expect the learning curve to be completed by the beginning of the third quarter. Appendix D-7 Water Play, Inc. Revised Manufacturing Overhead Budget -- Part 3 Year 1 Year 2 Q1 Q2 Direct Labor Hours for Units Produced VO/H Rate per DLH Total Variable Overhead Total Fixed Overhead Total Overhead Less: Depreciation Cash Mfg. O/H costs Q1 1.049,760 1.523,610 55.37 54.306 58,125.600 82.740.487.5 49,496,184 6 2,468,0101 107,621,784 145,208,497.5 5.350,000 5.350,000 102,271,7841139,858,497.5 Q3 1.620,000 53.241 86,250,000 5 5,350,000 141,600,000 5,350,000 136,250,000 04 1,620,000 53.241 86,250,000 55,350,000 141,600,000 5.350.000 136,250,000 Annual Total 5,813.370 53.904 313,366,087.5 222,664,194 36,030,281.5 21.400,000 $14,630,281.5 Appendix D-8 Water Play, Inc. Revised Selling and General Administrative Budget--Part 3 Year 1 Year 2 Q1 18,000 Units sold Variable SG&A cost/ unit Total Variable SG&A cost Total Fixed SG&A cost Total SG&A cost Less: Depreciation Cash SG&A costs Q1 11,000 2.520 27,720,000 93,665,625 121,385,625 1,037,500 120.348,125 Q2 16,000 2.4721 39,552,000 92,756,250 132,308,250 1,037,500 131,270.750 Q3 18,000 2,400 43,200,000 90,937,500 134,137,500 1,037,500 133,100,000 04 18,000 2,400 43,200,000 90,937,500 134,137,500 1,037,500 133,100,000 Annual Total 63,000 2,439.238 153,672.000 368,296,875 521,968,875 4,150,000 517.818.875 Appendix D-9 Water Play, Inc. Revised Finished Goods Inventory Year 1 Based on Standard Cost Finished Good Inventory units Units Produced 1,800 63,000 Direct Materials/unit Direct Labor/unit Manufacturing Overhead/unit Product Cost/ unit Ending FG Inventory units Ending FG Inventory 7.500 2.889 7.866.667 18,255.667 1.800 32,860,200 Beginning Finished Goods Inventory Cost of Goods Manufactured Goods Available for Sale Ending FG Inventory Cost of Goods Sold 32,860,200 1.150,107,000 1.182,967,200 32,860,200 1.150,107,000 Assuming a FIFO cost flow assumption and use the "standard" cost for ending finished goods inventory and cost of goods sold. Appendix D-10 Water Play, Inc. Revised Cash Budget December 31, 20XX 01 02 03 04 Year Beginning cash balance Cash collections Cash available Disbursements: Material purchases Direct labor Manufacturing overhead Selling and administrative Total disbursements Excess or (Deficiency) Financing section: Borrowings Repayments Interest on long-term note Interest on short-term borrowing Financing total Ending cash balance Appendix D-11 Water Play, Inc. Revised Income Statement For Year Ended December 31, 20XX Sales revenue Less Cost of goods sold Gross margin Operating expenses: Selling and administrative expenses Bad debts expense Total operating expenses Net operating income Interest expense Net income Appendix D-12 Water Play, Inc. Revised Balance Sheet December 31, 20XX Assets Currrent assets: Cash Accounts receivable Raw material inventory Finished goods inventory Total current assets Noncurrent assets: Land Buildings Equipment Less: Accumulated depreciation Total Noncurrent Assets Total Assets oldings Liabilities Current liabilities: Accounts payable Noncurrent liabilities: Note payable Total liabilities Stockholders' Equity Common stock ($1 par value, 25 million shares authorized, 3 million shares issued and outstanding Paid in capital Total contributed capital Retained earnings Total stockholders' equity Total liabilities and stockholders' equity 3,000,000 142,360,200 145,360,200 Appendix B-9 Water Play, Inc. Cash Budget December 31, 20XX 102 103 104 1 Beginning cash balance Cash collections Cash available Disbursements: Material purchases Direct labor Manufacturing overhead Selling and administrative Total disbursements Excess or (Deficiency) Financing section: Borrowings Repayments Interest on long-term note Interest on short-term borrowing Financing total Ending cash balance Appendix B-11 Water Play, Inc. Balance Sheet December 31, 20XX Assets Currrent assets: Cash Accounts receivable Raw material inventory Finished goods inventory Total current assets Noncurrent assets: Land Buildings Equipment Less: Accumulated depreciation Total Noncurrent Assets Total Assets Liabilities Current liabilities: Accounts payable Noncurrent liabilities: Note payable Total liabilities Stockholders' Equity Common stock ($1 par value, 25 million shares authorized, 3 million shares issued and outstanding Paid in capital Total contributed capital Retained earnings Total stockholders' equity Total liabilities and stockholders' equity 3,000,000 142,360,200 145,360,200 The company adopted the constant demand sales pattern budgets developed in part 2. In quarter one, the company actually sold 11,000 units and in quarter two, 16,000 vehicles. The company experienced some difficulty getting the advertising message out to the target market. Funding for the national campaign was reduced but Water Play shifted those funds to do local advertising through cooperative advertising contracts with local dealers. This two-pronged advertising campaign has seemed to work better based on the second quarter results. Orders for quarters three and four from dealers are strong and it appears the sales mark of 18,000 units will be met in each of the two remaining quarters. The accountants have revised the following budget schedules having put in the actual units sold and produced and actual costs for quarters one and two: sales, production, direct materials, direct labor, manufacturing overhead, selling and general administrative expenses and finished goods schedules have been revised and are provided in appendices D-3 through D-9; these appendices will be used to prepare a revised cash budget, income statement and balance sheet which are provided in appendices D-10 through D12. The background data is provided in appendices D-1 and D-2 which will be used to calculate the cost variances for quarters one and two. The variance tables are found in appendices D-13 through D-18. As the new cost analyst for Water Play, Inc., you have been asked to calculate cost variances and prepare a variance report explaining the potential causes of these variances. Explain potential causes of the variances in light of the fact that this is a startup company that has no experience manufacturing the Shark Scout vehicle. For example, it is typical that material components will be redesigned early in the year as manufacturing experience is gained and feedback from customers and dealers about the vehicles functionality/safety are obtained. Water Play's engineers work in conjunction with suppliers to redesign (develop new parts' specifications) components. These suppliers would then need to renegotiate the component's prices for those parts based on the design change. This could lead to either higher or lower material prices for specific components than what was originally forecasted. The material quantity standards have been set as ideal while the labor quantity standard has been set as practical. There are also many issues surrounding new laborers unfamiliar with the manufacturing process which can lead to several different variances being unfavorable. In quarter one, the damage to material components during installation led to higher rework costs to repair the damaged parts and vehicles. The reduced volume of production in quarter one of 10,800 units instead of the original 18,000 budgeted, led to Water Play delaying the hiring of factory managers reducing the amount spent on supervisors' salaries and benefits; by quarter two, the increased production to 16,200 required adding another work shift and necessitating hiring of the full complement of supervisors that were originally budgeted. Also, since many unfavorable variances resulted from inexperienced workers in quarter one, the company decided to increase budgeted spending on training costs in quarter two in order to reduce unfavorable variances generated in quarter one. Information concerning the actual quantities and prices for the three most costly material components, direct labor, variable overhead and fixed overhead are provided in appendices D-1 and D-2. The standard prices have also been included. However, you will need to calculate the standard quantity allowed for materials used and the direct labor hours so the variances can be calculated. 2. Using the revised year one budget schedules provided in appendices D-3 through D-9, prepare a cash budget, an absorption format income statement, and a balance sheet for the year assuming a FIFO cost flow assumption for determining ending finished goods inventory and cost of goods sold (income statement and balance sheet) provided in appendix D-9. Appendices D-10 through D-12 provide the formats for the cash budget, income statement and balance sheet. Compare and comment on the differences between the original budgeted information and the revised budgeted cash budget, income statement and balance sheet. Refer to part two constant demand budget for comparative purposes found in appendices B-9 through B-11. Calculate percentage of change in items on the income statement and balance sheet (horizontal rate of change) comparing the original constant demand budget to the revised income statement and balance sheet and discuss the major changes and causes. Appendix D-1 Water Play, Inc. Index Sheet Materials Scat Assembly Engine Block Diving Bell Suit Quarter 1 Purchase Oly Quantity Used Purchase Price Standard Price 11.500 11,600 Actual Oy Produced Qer 11.650 11.680 1.248 1.200 11.600 11.630 1.275 1.250 Actual Oy Produced Oer 2 16.200 Quarter 2 Purchase ty Quantity Used Purchase Price Standard Price 16,300 16,420 16,300 16.550 1.248 1.200 16 350 16.500 1.275 1.250 651 Budited Annual Sales New Material price per unit - Actual cost Direct Laber Quarter Actual Hours Actual Rate Standard Rate 1.049,760 32.1 Quarter 2 Actual Hours Actual Rate Standard Rate 1.521,610 30.495 Variable Overhead Quarter 1 Actual Rate Standard Rate Total Variable OH $58,125,600 55.37 Quarter 2 Actual Rate Standard Rale 54 106 53.241 $82,740,488 Fixed Overhead Quarter 1 Actual Rate Standard Rate Total Fixed OH $49,496,184 47.15 34.167 Quarter 2 Actual Rate Standard Rate 1.523,610 $62.468,010 Selling and General Administrative Expenses Variable Quarter Actual Rate Standard Rate 93.665.625 Quarter 2 Actual Rale Standard Rate 92.756.250 90.937.500 Minimum Line of Credit 100.000.000 Reginning FG Inventory Under Constant Demand Appendix D-2 Water Play, Inc. Actual Data for Variance Reports as of June 30, 20XX Part 3 Direct Materials: We are going to focus on three components: Part numbers 54689009 Seat Assembly, 54689007 Engine Block/Assembly, and 54689014 Diving Bell Suit. The following information has been provided by the purchasing and accounting information systems: Quantity Purchased Actual Price Quantity Used Standard Price 700 Quarter 1 Seat Assembly Engine Block Diving Bell Suit 11.500 11.650 11,600 651 1,248 1.275 11,600 11,680 11,630 1,200 1,250 Quarter 2 Seat Assembly Engine Block Diving Bell Suit 16,300 16,300 16,350 651 1,248 1,275 16,420 16,550 16,500 700 1,200 1.250 Direct Labor: Standard Rate Actual Hours Actual Rate Standard Hours Quarter 1 1.049,760 28.89 Quarter 2 1,523,610 30.495 See Direct Labor Budget revised for verification of Actual Hours and Actual Rate Variable Overhead: Standard Hours Quarter 1 Quarter 2 Actual Hours 1,049,760 1,523,610 Actual Rate 55.37 54.306 Standard Rate 53.241 53.241 Fixed Overhead: Standard Hours Actual Hours 1.049,760 1,523,610 Actual Rate 47.15 Quarter 1 Quarter 2 Standard Rate 34.167 34.167 Quarter i Sales Quarter 2 Sales Quarter 1 Production Quarter 2 Production 11.000 16,000 10.800 16,200 Appendix D-3 Collection in quarter of sale Collection in quarter following sale 0.67 0.325 Water Play, Inc. Revised Sales Budget -- Part 3 Year 1 Annual Total Q1 11,000 30,000 330,000,000 Unit Sales Selling Price per unit Total Sales Revenue Q2 16.000 30,000 480,000,000 Q3 18.000 30,000 540,000,000 Year 2 Q1 18,000 Q4 18.000 30,000 540,000,000 63.000 30,000 1,890,000,000 Cash Collections Schedule 221,100,000 107,250,000 321,600,000 Beginning A/R balance Q1 collection of Ql sales Q2 collection of Q1 sales Q2 collection of Q2 sales Q3 collection of Q2 sales Q3 collection of Q3 sales Q4 collection of Q3 sales Q4 collection of 04 sales Total Cash Collections by Qtr. 156,000,000 361,800,000 221,100,000 107,250,000 321,600,000 156,000,000 361,800,000 175,500,000 361,800,000 1,705,050,000 175,500,000 361,800,000 537,300,000 221,100,000 428,850,000 517,800,000 Ending A/R 175,500,000 Bad Debts Expense 9,450,000 Appendix D-4 Water Play, Inc. Revised Production Budget--Part 3 Year 1 Q2 18,000 Sales Units Desired Ending FG units Total Units Needed Less Beginning FG units Units to be Produced 01 11,000 1,600 12,600 1,800 10,800 02 16,000 1,800| 17.800 1,600 16,200 Q3 18,000 1,800 19.800 1,800 18,000 Q4 18,000 1,800 19.800 1,800 18,000 Annual Total 63,000 1,800 64.800 1,800 63,000 Year 2 Q1 18,000 1.800 19.800 1,800 18,000 Appendix D-5 Cash collected quarter of sale Cash collected following quarter 0.63 0.37 Water Play, Inc. Revised Materials Budget--Part 3 Year 1 Year 2 Q1 18,000 7.500 1 35,000,000 Units to be Produced Direct Material Cost/unit Total Direct Material Cost Desired Ending Inventory (10%) Direct Material Cost Needed Less Beginning Inventory Direct Material Purchases Q1 10,800 7,6501 82,620,000 12,393.000 95,013,000 13,500,000 81,513,000 Q2 16,200 7,650 123.930,000 13,500,000 137,430,000 12.393,000 125.037.000 Q3 18,000 7,500 135,000,000 13,500,000 148,500,000 13,500,000 135,000,000 Annual Total 63,000 7.564.286 476,550,000 13,500,000 490,050,000 13,500,000 476,550,000 Q4 18,000 7,500 135.000.000 13,500,000 148,500,000 13.500.000 135.000.000 Cash Disbursements Schedule 51,353,190 30,159,810 78,773.310 Beginning A/P balance Q1 payment of QI purchases Q2 payment of QI purchases Q2 payment of Q2 purchases Q3 payment of Q2 purchases Q3 payment of Q3 purchases Q4 payment of Q3 purchases Q4 payment of Q4 purchases Total Payments by Quarter 46,263,690 85,050,000 0 51.353,190 30,159,810 78.773,310 46.263,690 85,050,000 49,950,000 85,050,000 426,600,000 49,950,000 85,050.000 135,000,000 31,353,190 108,933,120 131,313,690 Ending A/P Balance 49,950,000 Appendix D-6 Water Play, Inc. Revised Direct Labor Budget - Part 3 Year 1 Q3 04 Year 2 Q1 18.000 18,000 Units to be Produced X Direct Labor Hours/unit Total DLHs for units produced X Average Hourly Labor Rate Total Direct Labor Cost 90 01 10.800 97.21 1.049,760 28.89 30,327,566, 4 02 16,200 94.05 1.523.610 30.495 4 6,462,486,95 Annual Total 63,000 92.2761 5,813,370 31.1 180,794,053,35 18.000 901 1.620,000 32.1 52,002,000 1.620,000 32.1 1.620,000 32.1 52.002,000 52,002.000 The first two quarters reflect the "actual" hours our employees worked instead of the standard hours. We have used the standard hours for the remaining two quarters since we expect the learning curve to be completed by the beginning of the third quarter. Appendix D-7 Water Play, Inc. Revised Manufacturing Overhead Budget -- Part 3 Year 1 Year 2 Q1 Q2 Direct Labor Hours for Units Produced VO/H Rate per DLH Total Variable Overhead Total Fixed Overhead Total Overhead Less: Depreciation Cash Mfg. O/H costs Q1 1.049,760 1.523,610 55.37 54.306 58,125.600 82.740.487.5 49,496,184 6 2,468,0101 107,621,784 145,208,497.5 5.350,000 5.350,000 102,271,7841139,858,497.5 Q3 1.620,000 53.241 86,250,000 5 5,350,000 141,600,000 5,350,000 136,250,000 04 1,620,000 53.241 86,250,000 55,350,000 141,600,000 5.350.000 136,250,000 Annual Total 5,813.370 53.904 313,366,087.5 222,664,194 36,030,281.5 21.400,000 $14,630,281.5 Appendix D-8 Water Play, Inc. Revised Selling and General Administrative Budget--Part 3 Year 1 Year 2 Q1 18,000 Units sold Variable SG&A cost/ unit Total Variable SG&A cost Total Fixed SG&A cost Total SG&A cost Less: Depreciation Cash SG&A costs Q1 11,000 2.520 27,720,000 93,665,625 121,385,625 1,037,500 120.348,125 Q2 16,000 2.4721 39,552,000 92,756,250 132,308,250 1,037,500 131,270.750 Q3 18,000 2,400 43,200,000 90,937,500 134,137,500 1,037,500 133,100,000 04 18,000 2,400 43,200,000 90,937,500 134,137,500 1,037,500 133,100,000 Annual Total 63,000 2,439.238 153,672.000 368,296,875 521,968,875 4,150,000 517.818.875 Appendix D-9 Water Play, Inc. Revised Finished Goods Inventory Year 1 Based on Standard Cost Finished Good Inventory units Units Produced 1,800 63,000 Direct Materials/unit Direct Labor/unit Manufacturing Overhead/unit Product Cost/ unit Ending FG Inventory units Ending FG Inventory 7.500 2.889 7.866.667 18,255.667 1.800 32,860,200 Beginning Finished Goods Inventory Cost of Goods Manufactured Goods Available for Sale Ending FG Inventory Cost of Goods Sold 32,860,200 1.150,107,000 1.182,967,200 32,860,200 1.150,107,000 Assuming a FIFO cost flow assumption and use the "standard" cost for ending finished goods inventory and cost of goods sold. Appendix D-10 Water Play, Inc. Revised Cash Budget December 31, 20XX 01 02 03 04 Year Beginning cash balance Cash collections Cash available Disbursements: Material purchases Direct labor Manufacturing overhead Selling and administrative Total disbursements Excess or (Deficiency) Financing section: Borrowings Repayments Interest on long-term note Interest on short-term borrowing Financing total Ending cash balance Appendix D-11 Water Play, Inc. Revised Income Statement For Year Ended December 31, 20XX Sales revenue Less Cost of goods sold Gross margin Operating expenses: Selling and administrative expenses Bad debts expense Total operating expenses Net operating income Interest expense Net income Appendix D-12 Water Play, Inc. Revised Balance Sheet December 31, 20XX Assets Currrent assets: Cash Accounts receivable Raw material inventory Finished goods inventory Total current assets Noncurrent assets: Land Buildings Equipment Less: Accumulated depreciation Total Noncurrent Assets Total Assets oldings Liabilities Current liabilities: Accounts payable Noncurrent liabilities: Note payable Total liabilities Stockholders' Equity Common stock ($1 par value, 25 million shares authorized, 3 million shares issued and outstanding Paid in capital Total contributed capital Retained earnings Total stockholders' equity Total liabilities and stockholders' equity 3,000,000 142,360,200 145,360,200 Appendix B-9 Water Play, Inc. Cash Budget December 31, 20XX 102 103 104 1 Beginning cash balance Cash collections Cash available Disbursements: Material purchases Direct labor Manufacturing overhead Selling and administrative Total disbursements Excess or (Deficiency) Financing section: Borrowings Repayments Interest on long-term note Interest on short-term borrowing Financing total Ending cash balance Appendix B-11 Water Play, Inc. Balance Sheet December 31, 20XX Assets Currrent assets: Cash Accounts receivable Raw material inventory Finished goods inventory Total current assets Noncurrent assets: Land Buildings Equipment Less: Accumulated depreciation Total Noncurrent Assets Total Assets Liabilities Current liabilities: Accounts payable Noncurrent liabilities: Note payable Total liabilities Stockholders' Equity Common stock ($1 par value, 25 million shares authorized, 3 million shares issued and outstanding Paid in capital Total contributed capital Retained earnings Total stockholders' equity Total liabilities and stockholders' equity 3,000,000 142,360,200 145,360,200
