Question
The company has a cost of capital that ranges from: Rate Project risk 8% low 10% average 13% high risk The coefficient of variation NPV
The company has a cost of capital that ranges from:
Rate Project risk
8% low
10% average
13% high risk
The coefficient of variation NPV for Average risk project is between .8 and 1.2
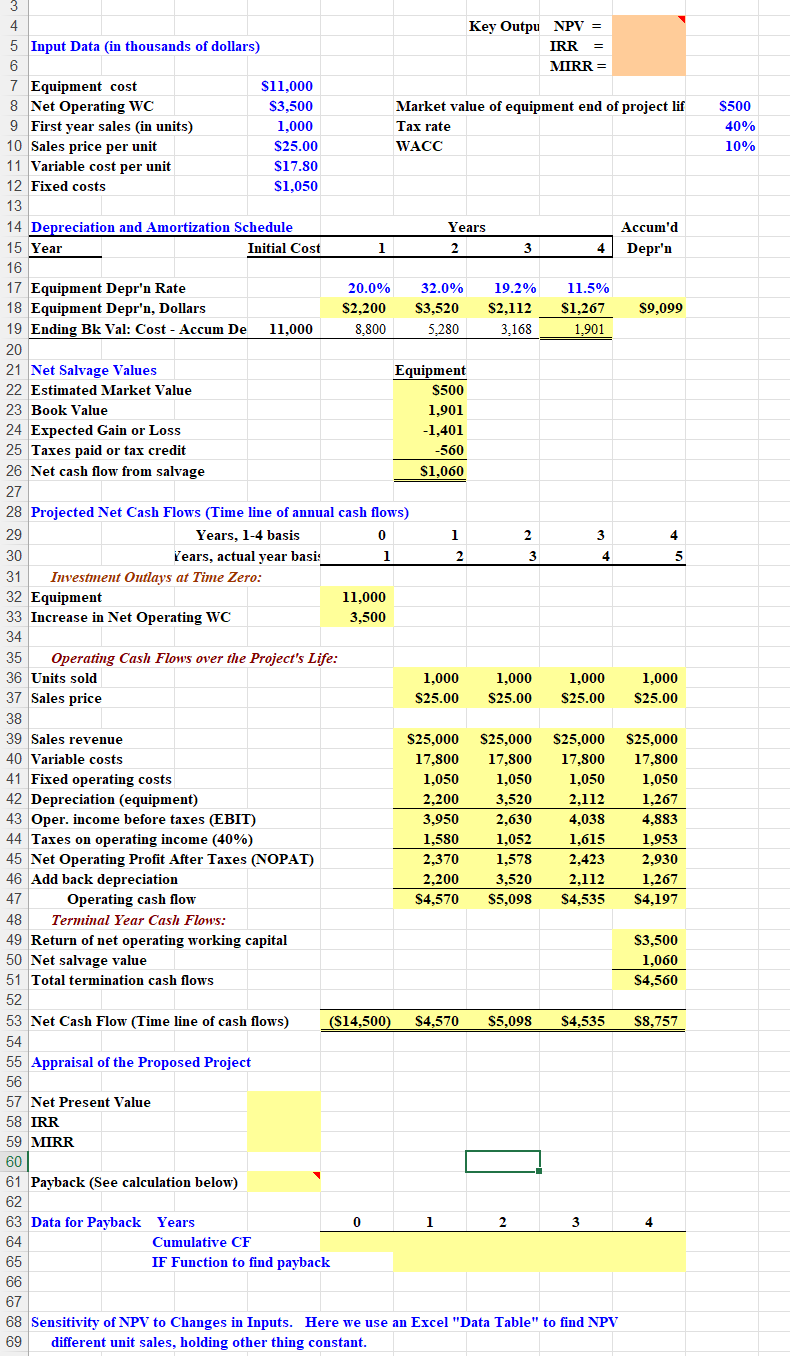
Create a spreadsheet and use it to find the projects NPV, IRR and payback. Your spreadsheet should have the following sections: Input Data (in thousands of dollars), Depreciation and Amortization Schedule, Net Salvage Values, Projected Net Cash Flows (Time line of annual cash flows), Appraisal of the Proposed Project (NPV, IRR, MIRR, Payback (using if statement). Using Excels Data Table Examine the sensitivity of NPV to changes in inputs (sales, WACC, variable costs, fixed costs, sales price). Graph the results.

Step by Step Solution
There are 3 Steps involved in it
Step: 1

Get Instant Access to Expert-Tailored Solutions
See step-by-step solutions with expert insights and AI powered tools for academic success
Step: 2

Step: 3

Ace Your Homework with AI
Get the answers you need in no time with our AI-driven, step-by-step assistance
Get Started


