Answered step by step
Verified Expert Solution
Question
1 Approved Answer
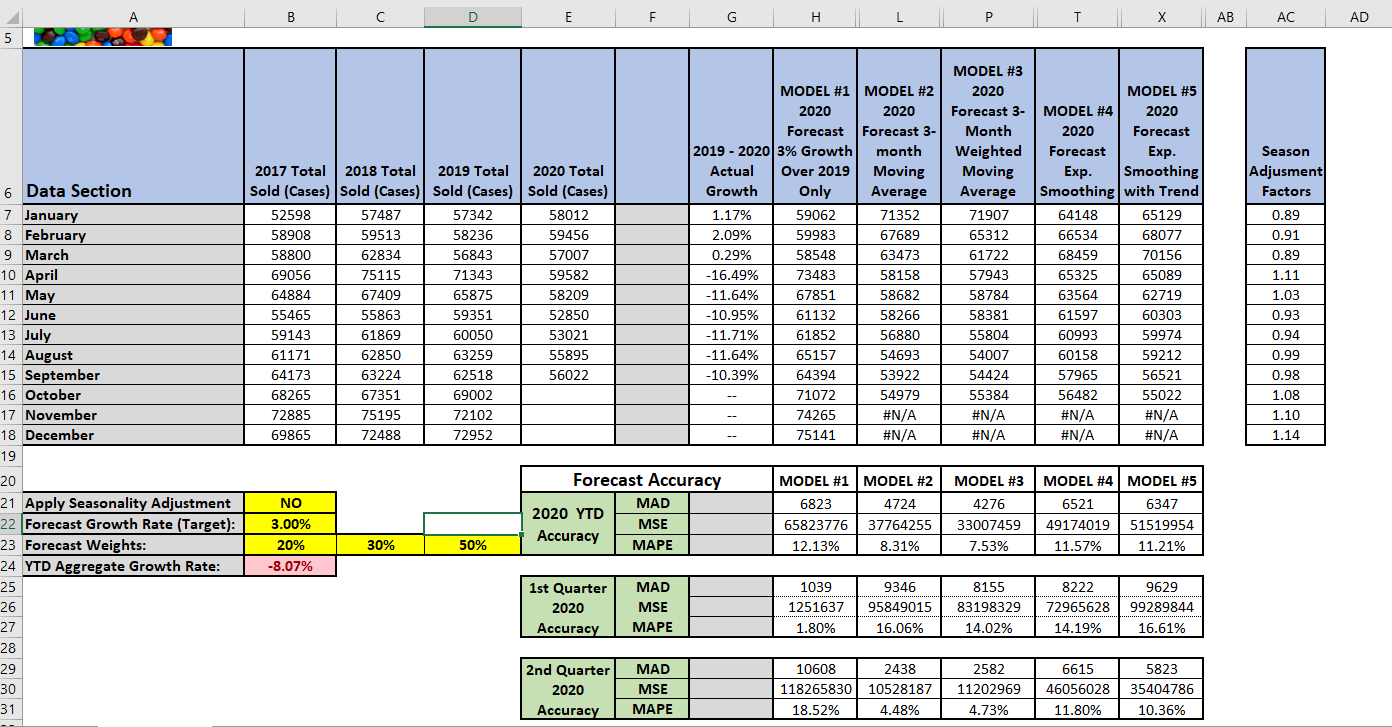
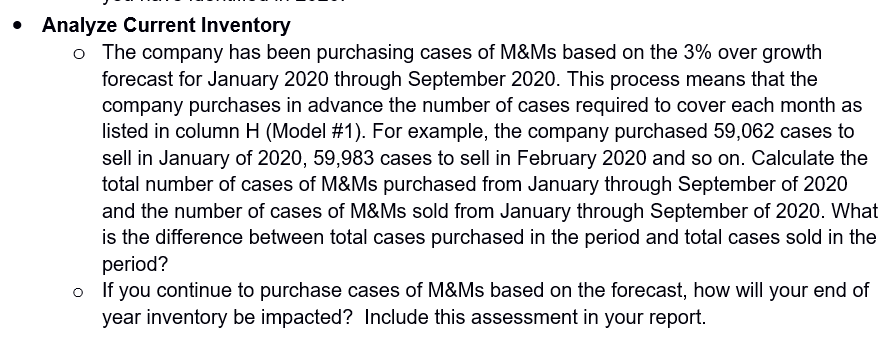
The company has been purchasing cases of M&Ms based on the 3% over growth forecast for January 2020 through September 2020. This process means that
- The company has been purchasing cases of M&Ms based on the 3% over growth forecast for January 2020 through September 2020. This process means that the company purchases in advance the number of cases required to cover each month as listed in column H (Model #1). For example, the company purchased 59,062 cases to sell in January of 2020, 59,983 cases to sell in February 2020 and so on. Calculate the total number of cases of M&Ms purchased from January through September of 2020 and the number of cases of M&Ms sold from January through September of 2020. What is the difference between total cases purchased in the period and total cases sold in the period?
If you continue to purchase cases of M&Ms based on the forecast, how will your end of year inventory be impacted? Include this assessment in your report.
This is the whole question
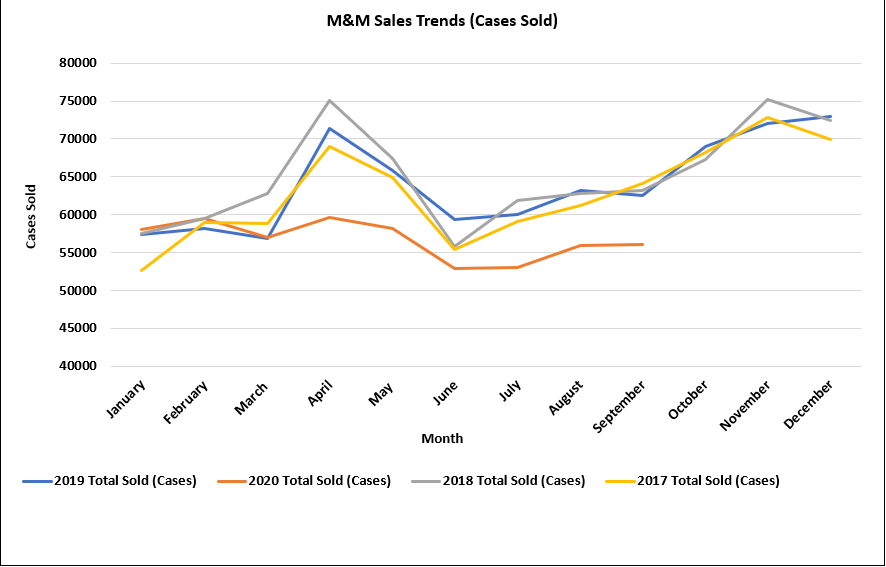
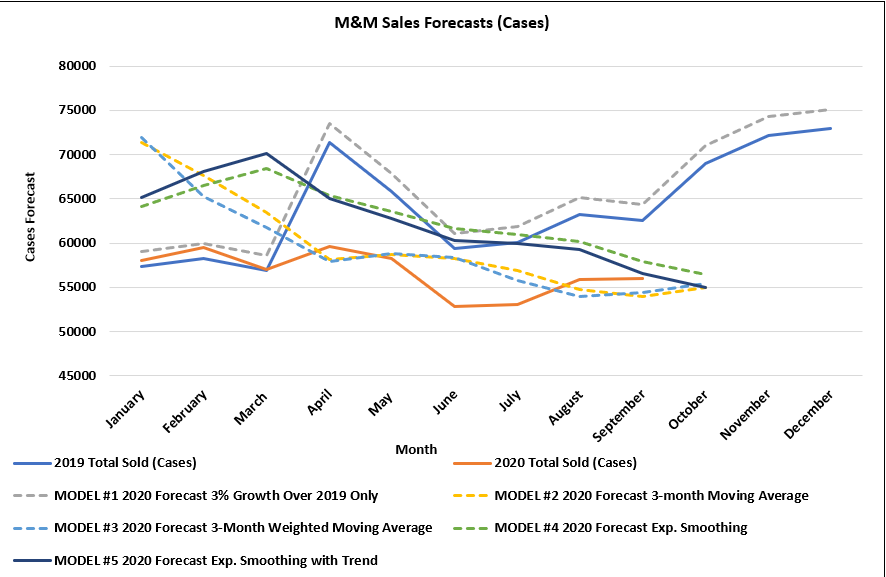
B D E H T X AB AC AD 2017 Total 2018 Total 2019 Total 2020 Total Sold (Cases) Sold (Cases) Sold (Cases) Sold (Cases) 52598 57487 57342 58012 58908 59513 58236 59456 58800 62834 56843 57007 69056 75115 71343 59582 64884 67409 65875 58209 55465 55863 59351 52850 59143 61869 60050 53021 61171 62850 63259 55895 64173 63224 62518 56022 68265 67351 69002 72885 75195 72102 69865 72488 72952 MODEL #1 MODEL #2 2020 2020 Forecast Forecast 3- 2019-2020 3% Growth month Actual Over 2019 Moving Growth Only Average 1.17% 59062 71352 2.09% 59983 67689 0.29% 58548 63473 -16.49% 73483 58158 -11.64% 67851 58682 -10.95% 61132 58266 -11.71% 61852 56880 -11.64% 65157 54693 -10.39% 64394 53922 71072 54979 74265 #N/A 75141 #N/A MODEL #3 2020 Forecast 3- Month Weighted Moving Average 71907 65312 61722 57943 58784 58381 55804 54007 54424 55384 #N/A #N/A MODEL #5 MODEL #4 2020 2020 Forecast Forecast Exp. Exp. Smoothing Smoothing with Trend 64148 65129 66534 68077 68459 70156 65325 65089 63564 62719 61597 60303 60993 59974 60158 59212 57965 56521 56482 55022 #N/A #N/A #N/A #N/A Season Adjusment Factors 0.89 0.91 0.89 1.11 1.03 0.93 0.94 0.99 0.98 1.08 1.10 1.14 6 Data Section 7 January 8 February 9 March 10 April 11 May 12 June 13 July 14 August 15 September 16 October 17 November 18 December 19 20 21 Apply Seasonality Adjustment 22 Forecast Growth Rate (Target): 23 Forecast Weights: 24 YTD Aggregate Growth Rate: 25 26 27 28 29 30 31 NO 3.00% 20% -8.07% Forecast Accuracy MAD 2020 YTD MSE Accuracy MAPE MODEL #1 6823 65823776 12.13% MODEL #2 4724 37764255 8.31% MODEL #3 4276 33007459 7.53% MODEL #4 6521 49174019 11.57% MODEL #5 6347 51519954 11.21% 30% 50% 1st Quarter 2020 Accuracy MAD MSE MAPE 1039 1251637 1.80% 9346 95849015 16.06% 8155 83198329 14.02% 8222 72965628 14.19% 9629 99289844 16.61% 5823 2nd Quarter 2020 Accuracy MAD MSE MAPE 10608 118265830 2438 10528187 4.48% 2582 11202969 4.73% 6615 46056028 11.80% 35404786 10.36% 18.52% M&M Sales Trends (Cases Sold) 80000 75000 70000 65000 Cases Sold 60000 55000 50000 45000 40000 April May June July August January March September November February October December Month -2019 Total Sold (Cases) -2020 Total Sold (Cases) 2018 Total Sold (Cases) 2017 Total Sold (Cases) M&M Sales Forecasts (Cases) 80000 75000 70000 65000 Cases Forecast 60000 55000 50000 45000 March July April May June January September February August October November December Month 2019 Total Sold (Cases) 2020 Total Sold (Cases) MODEL #2 2020 Forecast 3-month Moving Average MODEL#1 2020 Forecast 3% Growth Over 2019 Only MODEL #3 2020 Forecast 3-Month Weighted Moving Average MODEL #5 2020 Forecast Exp. Smoothing with Trend MODEL #4 2020 Forecast Exp. Smoothing Analyze Current Inventory o The company has been purchasing cases of M&Ms based on the 3% over growth forecast for January 2020 through September 2020. This process means that the company purchases in advance the number of cases required to cover each month as listed in column H (Model #1). For example, the company purchased 59,062 cases to sell in January of 2020, 59,983 cases to sell in February 2020 and so on. Calculate the total number of cases of M&Ms purchased from January through September of 2020 and the number of cases of M&Ms sold from January through September of 2020. What is the difference between total cases purchased in the period and total cases sold in the period? o If you continue to purchase cases of M&Ms based on the forecast, how will your end of year inventory be impacted? Include this assessment in your report. B D E H T X AB AC AD 2017 Total 2018 Total 2019 Total 2020 Total Sold (Cases) Sold (Cases) Sold (Cases) Sold (Cases) 52598 57487 57342 58012 58908 59513 58236 59456 58800 62834 56843 57007 69056 75115 71343 59582 64884 67409 65875 58209 55465 55863 59351 52850 59143 61869 60050 53021 61171 62850 63259 55895 64173 63224 62518 56022 68265 67351 69002 72885 75195 72102 69865 72488 72952 MODEL #1 MODEL #2 2020 2020 Forecast Forecast 3- 2019-2020 3% Growth month Actual Over 2019 Moving Growth Only Average 1.17% 59062 71352 2.09% 59983 67689 0.29% 58548 63473 -16.49% 73483 58158 -11.64% 67851 58682 -10.95% 61132 58266 -11.71% 61852 56880 -11.64% 65157 54693 -10.39% 64394 53922 71072 54979 74265 #N/A 75141 #N/A MODEL #3 2020 Forecast 3- Month Weighted Moving Average 71907 65312 61722 57943 58784 58381 55804 54007 54424 55384 #N/A #N/A MODEL #5 MODEL #4 2020 2020 Forecast Forecast Exp. Exp. Smoothing Smoothing with Trend 64148 65129 66534 68077 68459 70156 65325 65089 63564 62719 61597 60303 60993 59974 60158 59212 57965 56521 56482 55022 #N/A #N/A #N/A #N/A Season Adjusment Factors 0.89 0.91 0.89 1.11 1.03 0.93 0.94 0.99 0.98 1.08 1.10 1.14 6 Data Section 7 January 8 February 9 March 10 April 11 May 12 June 13 July 14 August 15 September 16 October 17 November 18 December 19 20 21 Apply Seasonality Adjustment 22 Forecast Growth Rate (Target): 23 Forecast Weights: 24 YTD Aggregate Growth Rate: 25 26 27 28 29 30 31 NO 3.00% 20% -8.07% Forecast Accuracy MAD 2020 YTD MSE Accuracy MAPE MODEL #1 6823 65823776 12.13% MODEL #2 4724 37764255 8.31% MODEL #3 4276 33007459 7.53% MODEL #4 6521 49174019 11.57% MODEL #5 6347 51519954 11.21% 30% 50% 1st Quarter 2020 Accuracy MAD MSE MAPE 1039 1251637 1.80% 9346 95849015 16.06% 8155 83198329 14.02% 8222 72965628 14.19% 9629 99289844 16.61% 5823 2nd Quarter 2020 Accuracy MAD MSE MAPE 10608 118265830 2438 10528187 4.48% 2582 11202969 4.73% 6615 46056028 11.80% 35404786 10.36% 18.52% M&M Sales Trends (Cases Sold) 80000 75000 70000 65000 Cases Sold 60000 55000 50000 45000 40000 April May June July August January March September November February October December Month -2019 Total Sold (Cases) -2020 Total Sold (Cases) 2018 Total Sold (Cases) 2017 Total Sold (Cases) M&M Sales Forecasts (Cases) 80000 75000 70000 65000 Cases Forecast 60000 55000 50000 45000 March July April May June January September February August October November December Month 2019 Total Sold (Cases) 2020 Total Sold (Cases) MODEL #2 2020 Forecast 3-month Moving Average MODEL#1 2020 Forecast 3% Growth Over 2019 Only MODEL #3 2020 Forecast 3-Month Weighted Moving Average MODEL #5 2020 Forecast Exp. Smoothing with Trend MODEL #4 2020 Forecast Exp. Smoothing Analyze Current Inventory o The company has been purchasing cases of M&Ms based on the 3% over growth forecast for January 2020 through September 2020. This process means that the company purchases in advance the number of cases required to cover each month as listed in column H (Model #1). For example, the company purchased 59,062 cases to sell in January of 2020, 59,983 cases to sell in February 2020 and so on. Calculate the total number of cases of M&Ms purchased from January through September of 2020 and the number of cases of M&Ms sold from January through September of 2020. What is the difference between total cases purchased in the period and total cases sold in the period? o If you continue to purchase cases of M&Ms based on the forecast, how will your end of year inventory be impacted? Include this assessment in your report Step by Step Solution
There are 3 Steps involved in it
Step: 1

Get Instant Access to Expert-Tailored Solutions
See step-by-step solutions with expert insights and AI powered tools for academic success
Step: 2

Step: 3

Ace Your Homework with AI
Get the answers you need in no time with our AI-driven, step-by-step assistance
Get Started


