The company has decided they needed to create a full set of budget schedules including financial statementsfor the first year of operations based on an
The company has decided they needed to create a full set of budget schedules including financial statementsfor the first year of operations based on an assumption of constant demand of 18,000 quarterly and 72,000 for the first year (appendices B-1 through B-11). A second set of budget schedules and financial statements based on expected unit sales of 15,000 in quarter one, 25,000 in quarter two, 20,000 in quarter three, and finally 12,000 in quarter four for a total of 72,000 for the year based on a seasonal demand pattern (appendices C-1 through C-11). We expect the same quarterly sales patterns in year two meaning 18,000 units per quarter under constant demand and 15,000 units in quarter one under seasonal demand. Compare the constant demand to the seasonal demand budget.
Explain the major differences in each of the budget schedules, cash budget and financial statements on both a quarterly and annual basis. Remember the beginning and ending raw material and finished goods inventory units will cause differences in the budgets but also focus on the differences between accrual and cash timing figures.
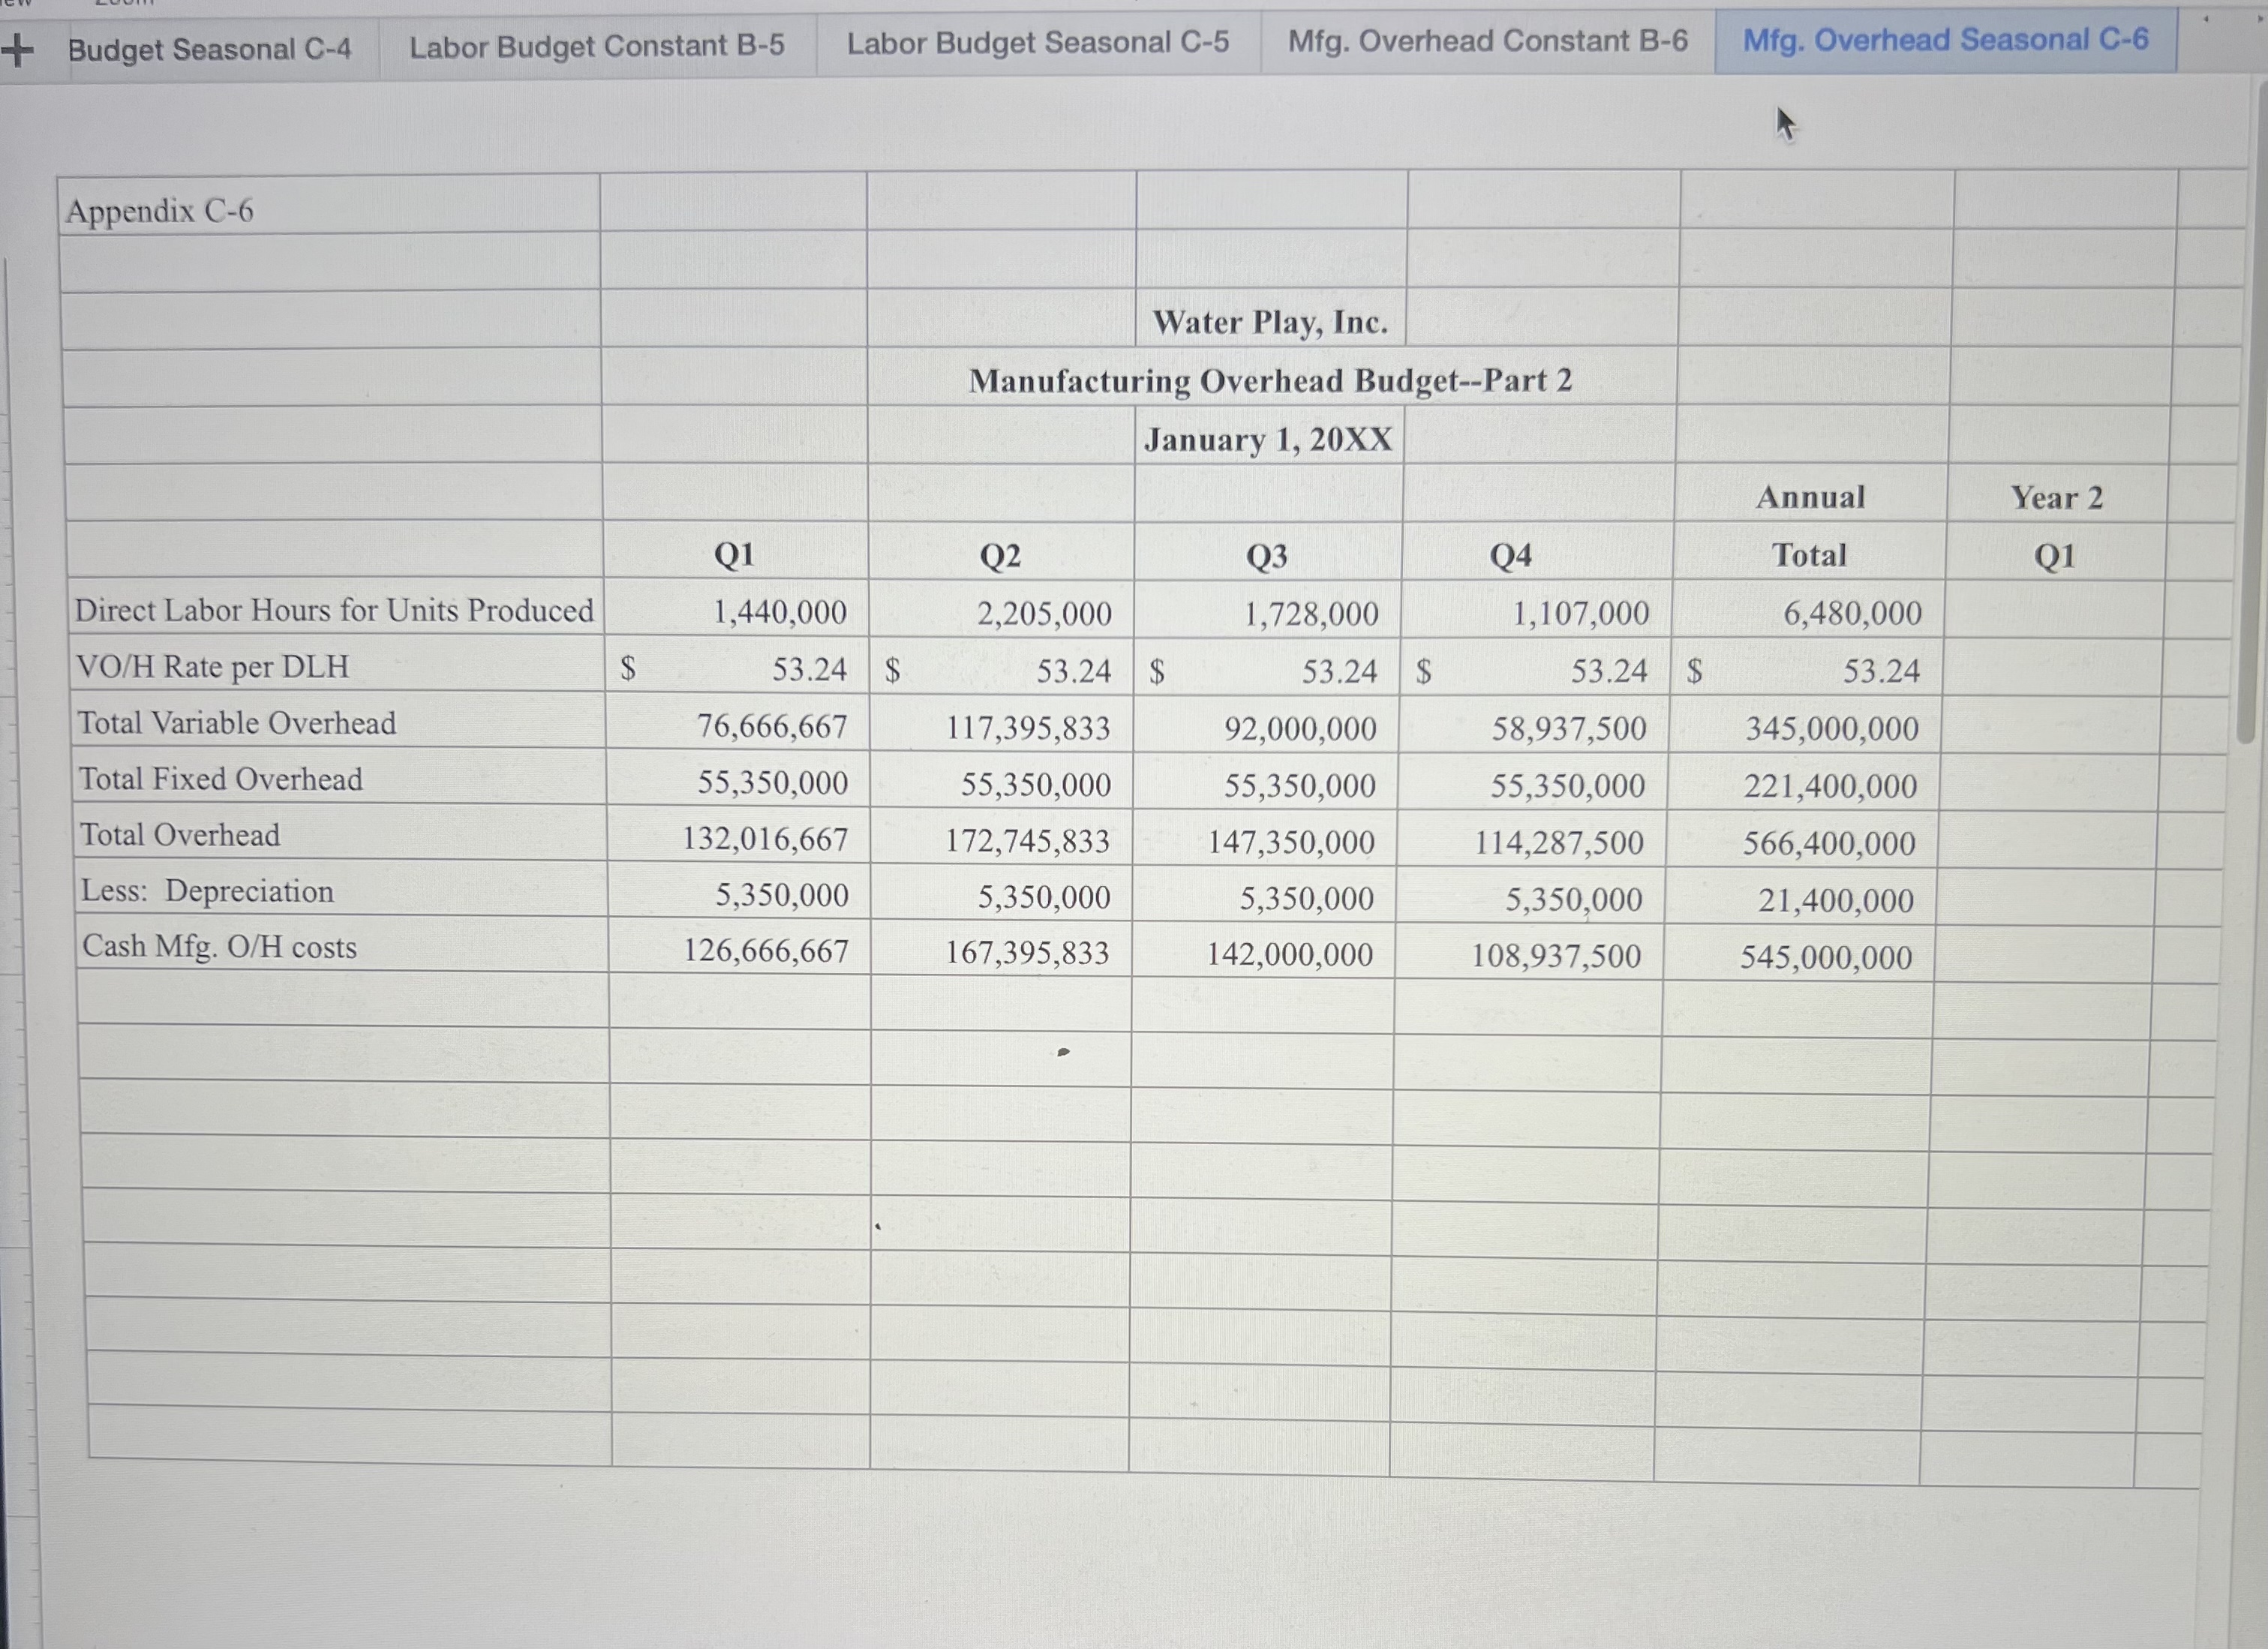
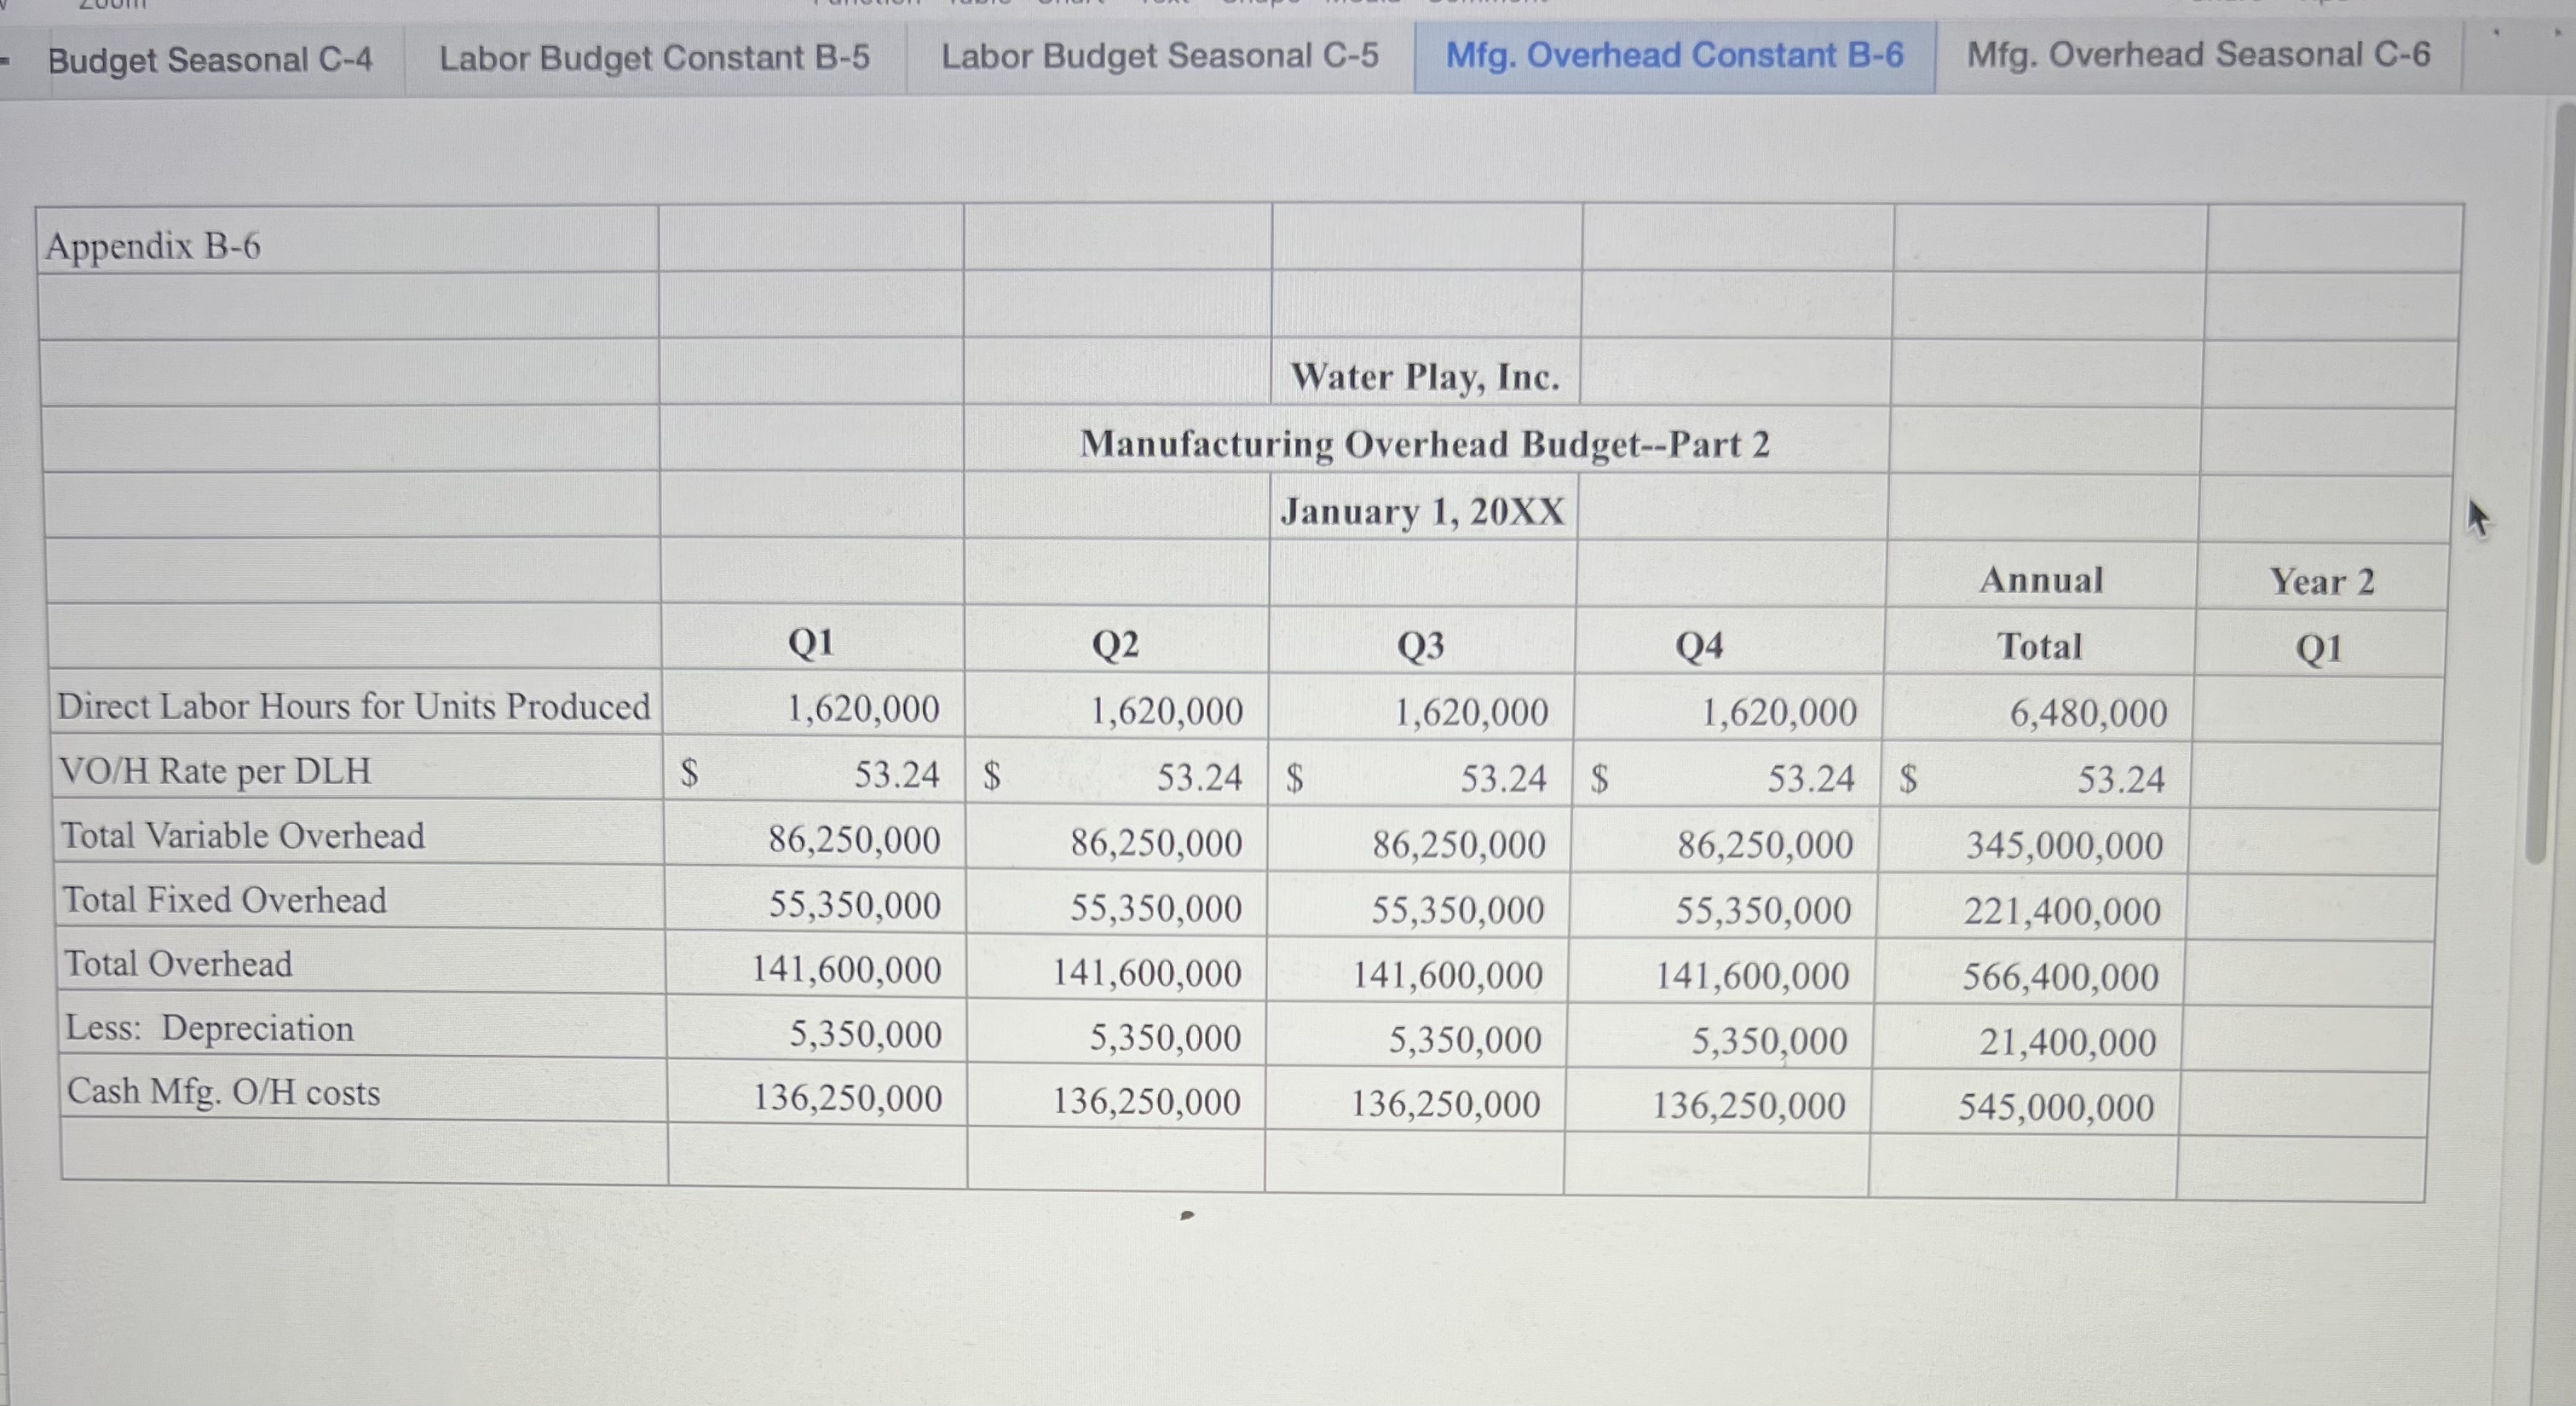
Budget Seasonal C-4 Labor Budget Constant B-5 Labor Budget Seasonal C-5 Mfg. Overhead Constant B-6 Mfg. Overhead Seasonal C-6 Appendix B-6 Water Play, Inc. Manufacturing Overhead Budget--Part 2 January 1, 20XX Annual Year 2 Q2 Q3 Q4 Total Q1 Direct Labor Hours for Units Produced 1,620,000 1,620,000 1,620,000 1,620,000 6,480,000 VO/H Rate per DLH $ 53.24 $ 53.24 $ 53.24 $ 53.24 53.24 Total Variable Overhead 86,250,000 86,250,000 86,250,000 86,250,000 345,000,000 Total Fixed Overhead 55,350,000 55,350,000 55,350,000 55,350,000 221,400,000 Total Overhead 141,600,000 141,600,000 141,600,000 141,600,000 566,400,000 Less: Depreciation 5,350,000 5,350,000 5,350,000 5,350,000 21,400,000 Cash Mfg. O/H costs 136,250,000 136,250,000 136,250,000 136,250,000 545,000,000+ Budget Seasonal C-4 Labor Budget Constant B-5 Labor Budget Seasonal C-5 Mfg. Overhead Constant B-6 Mfg. Overhead Seasonal C-6 Appendix C-6 Water Play, Inc. Manufacturing Overhead Budget--Part 2 January 1, 20XX Annual Year 2 Q1 Q2 Q3 Q4 Total Q1 Direct Labor Hours for Units Produced 1,440,000 2,205,000 1,728,000 1,107,000 6,480,000 VO/H Rate per DLH $ 53.24 $ 53.24 $ 53.24 $ 53.24 $ 53.24 Total Variable Overhead 76,666,667 117,395,833 92,000,000 58,937,500 345,000,000 Total Fixed Overhead 55,350,000 55,350,000 55,350,000 55,350,000 221,400,000 Total Overhead 132,016,667 172,745,833 147,350,000 1 14,287,500 566,400,000 Less: Depreciation 5,350,000 5,350,000 5,350,000 5,350,000 21,400,000 Cash Mfg. O/H costs 126,666,667 167,395,833 142,000,000 108,937,500 545,000,000+ Budget Seasonal C-4 Labor Budget Constant B-5 Labor Budget Seasonal C-5 Mfg. Overhead Constant B-6 Mfg. Overhead Seasonal C-6 Appendix C-6 Water Play, Inc. Manufacturing Overhead Budget--Part 2 January 1, 20XX Annual Year 2 Q1 Q2 Q3 Q4 Total Q1 Direct Labor Hours for Units Produced 1,440,000 2,205,000 1,728,000 1,107,000 6,480,000 VO/H Rate per DLH $ 53.24 $ 53.24 $ 53.24 $ 53.24 $ 53.24 Total Variable Overhead 76,666,667 117,395,833 92,000,000 58,937,500 345,000,000 Total Fixed Overhead 55,350,000 55,350,000 55,350,000 55,350,000 221,400,000 Total Overhead 132,016,667 172,745,833 147,350,000 1 14,287,500 566,400,000 Less: Depreciation 5,350,000 5,350,000 5,350,000 5,350,000 21,400,000 Cash Mfg. O/H costs 126,666,667 167,395,833 142,000,000 108,937,500 545,000,000Budget Seasonal C-4 Labor Budget Constant B-5 Labor Budget Seasonal C-5 Mfg. Overhead Constant B-6 Mfg. Overhead Seasonal C-6 Appendix B-6 Water Play, Inc. Manufacturing Overhead Budget--Part 2 January 1, 20XX Annual Year 2 Q2 Q3 Q4 Total Q1 Direct Labor Hours for Units Produced 1,620,000 1,620,000 1,620,000 1,620,000 6,480,000 VO/H Rate per DLH $ 53.24 $ 53.24 $ 53.24 $ 53.24 53.24 Total Variable Overhead 86,250,000 86,250,000 86,250,000 86,250,000 345,000,000 Total Fixed Overhead 55,350,000 55,350,000 55,350,000 55,350,000 221,400,000 Total Overhead 141,600,000 141,600,000 141,600,000 141,600,000 566,400,000 Less: Depreciation 5,350,000 5,350,000 5,350,000 5,350,000 21,400,000 Cash Mfg. O/H costs 136,250,000 136,250,000 136,250,000 136,250,000 545,000,000
Step by Step Solution
There are 3 Steps involved in it
Step: 1
Get Instant Access to Expert-Tailored Solutions
See step-by-step solutions with expert insights and AI powered tools for academic success
Step: 2
Step: 3
Ace Your Homework with AI
Get the answers you need in no time with our AI-driven, step-by-step assistance