The company has decided they needed to create a full set of budget schedules including financial statements for the first year of operations based on
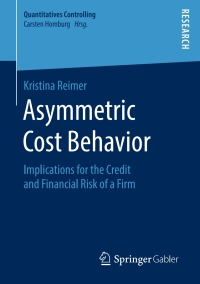
The company has decided they needed to create a full set of budget schedules including financial statements for the first year of operations based on an assumption of constant demand of 18,000 quarterly and 72,000 for the first year (appendices B-1 through B-11). A second set of budget schedules and financial statements based on expected unit sales of 15,000 in quarter one, 25,000 in quarter two, 20,000 in quarter three, and finally 12,000 in quarter four for a total of 72,000 for the year based on a seasonal demand pattern (appendices C-1 through C-11). We expect the same quarterly sales patterns in year two meaning 18,000 units per quarter under constant demand and 15,000 units in quarter one under seasonal demand. Compare the constant demand to the seasonal demand budget. Explain the major differences in each of the budget schedules, cash budget and financial statements on both a quarterly and annual basis. Remember the beginning and ending raw material and finished goods inventory units will cause differences in the budgets but also focus on the differences between accrual and cash timing figures.
125% - Fx B.IT Ina T ? View Zoom Function Table Chart Text Shape Media Comment Share Tips + udget Constant B-4 Material Budget Seasonal C-4 Labor Budget Constant B-5 Labor Budget Seasonal C-5 Mfg. Overhead Constant B-6 Appendix B-5 Water Play, Inc. Direct Labor Budget--Part 2 January 1, 20XX Annual Year 2 Q1 02 03 04 Total Q1 Units to be Produced 18,000 18,000 18,000 18,000 72,000 18,000 X Direct Labor Hours/unit 90 90 90 90 90 90 Total DLHs for units produced 1,620,000 1,620,000 1,620,000 1,620,000 6,480,000 1,620,000 X Average Hourly Labor Rate $32.10 $32.10 $32.10 $32.10 $32.10 $32.10 Total Direct Labor Cost 52,002,000 52,002,000 52,002,000 52,002,000 208,008,000 52,002,000+ sonal C-2 Production Budget Constant B-3 Production Budget Seasonal C-3 Material Budget Constant B-4 Material Budget Seasonal C-4 Water Play, Inc. Cash paid in quarter of purchase 63.0% Materials Budget--Part 2 Cash paid the following quarter 37.0% January 1, 20XX Annual Year 2 Q1 Q2 03 04 Total Q1 Units to be Produced 18,000 18,000 18,000 18,000 72,000 18,000 Direct Material Cost/unit $ 7,500 $ 7,500 7,500 $ 7,500 $ 7,500 $ 7,500 Total Direct Material Cost 135,000,000 135,000,000 135,000,000 135,000,000 540,000,000 135,000,000 Desired Ending Inventory (10%) 13,500,000 13,500,000 13,500,000 13,500,000 13,500,000 Direct Material Cost Needed 148,500,000 148,500,000 148,500,000 148,500,000 553,500,000 Less Beginning Inventory 13,500,000 13,500,000 13,500,000 13,500,000 13,500,000 Direct Material Purchases 135,000,000 135,000,000 135,000,000 135,000,000 540,000,000 Cash Disbursements Schedule Beginning A/P balance 0 -00 Q1 payment of Q1 purchases 85,050,000 85,050,000 Q2 payment of Q1 purchases 49,950,000 49,950,000 Q2 payment of Q2 purchases 85,050,000 85,050,000 Q3 payment of Q2 purchases 49,950,000 49,950,000 Q3 payment of Q3 purchases 85,050,000 85,050,000 Q4 payment of Q3 purchases 49,950,000 49,950,000 Q4 payment of Q4 purchases 85,050,000 85,050,000 Total Payments by Quarter 85,050,000 135,000,000 135,000,000 135,000,000 490,050,000 Ending A/P Balance 49,950,000+ Budget Seasonal C-4 Labor Budget Constant B-5 Labor Budget Seasonal C-5 Mfg. Overhead Constant B-6 Mfg. Overhead Seasonal C-6 Appendix C-6 Water Play, Inc. Manufacturing Overhead Budget--Part 2 January 1, 20XX Annual Year 2 Q1 Q2 03 Q4 Total Q1 Direct Labor Hours for Units Produced 1,440,000 2,205,000 1,728,000 1,107,000 6,480,000 VO/H Rate per DLH $ 53.24 $ 53.24 $ 53.24 $ 53.24 $ 53.24 Total Variable Overhead 76,666,667 117,395,833 92,000,000 58,937,500 345,000,000 Total Fixed Overhead 55,350,000 55,350,000 55,350,000 55,350,000 221,400,000 Total Overhead 132,016,667 172, 745,833 147,350,000 114,287,500 566,400,000 Less: Depreciation 5,350,000 5,350,000 5,350,000 5,350,000 21,400,000 Cash Mfg. O/H costs 126,666,667 167,395,833 142,000,000 108,937,500 545,000,000125% - fx ? View Zoom Function Table Chart Text Shape Media Comment Share Tips Judget Constant B-4 Material Budget Seasonal C-4 Labor Budget Constant B-5 Labor Budget Seasonal C-5 Mfg. Overhead Constant B-6 Appendix C-5 Water Play, Inc. Direct Labor Budget--Part 2 January 1, 20XX Annual Year 2 Q1 Q2 Q3 Total Q1 Units to be Produced 16,000 24,500 19,200 12,300 72,000 16,000 X Direct Labor Hours/unit 90 90 90 90 90 90 Total DLHs for units produced 1,440,000 2,205,000 1,728,000 1,107,000 6,480,000 1,440,000 X Average Hourly Labor Rate $32.10 $32.10 $32.10 $32.10 $32.10 $32.10 Total Direct Labor Cost 46,224,000 70,780,500 55,468,800 35,534,700 208,008,000 46,224,000View Zoom Function Production Budget Constant B-3 Production Budget Seasonal C-3 Material Budget Constant B-4 Material Budget Seasonal C-4 sonal C-2 Appendix C-4 Water Play, Inc. Cash collected quarter of sale 63.0% Materials Budget--Part 2 Cash collected following quarter 37.0% January 1, 20XX Annual Year 2 Q2 Q3 Q4 Total Q1 Units to be Produced 16,000 24,500 19,200 12,300 72,000 16,000 Direct Material Cost/unit $ 7,500 $ 7,500 $ 7,500 $ 7,500 $ 7,500 $ 7,500 Total Direct Material Cost 120,000,000 183,750,000 144,000,000 92,250,000 540,000,000 120,000,000 Desired Ending Inventory (10%) 18,375,000 14,400,000 9,225,000 12,000,000 12,000,000 Direct Material Cost Needed 138,375,000 198, 150,000 153,225,000 104,250,000 552,000,000 Less Beginning Inventory 12,000,000 18,375,000 14,400,000 9,225,000 12,000,000 Direct Material Purchases 126,375,000 179,775,000 138,825,000 95,025,000 540,000,000 Cash Disbursements Schedule Beginning A/P balance 0 -00 Q1 payment of Q1 purchases 79,616,250 79,616,250 Q2 payment of Q1 purchases 46,758,750 46,758,750 Q2 payment of Q2 purchases 1.13,258,250 113,258,250 Q3 payment of Q2 purchases 66,516,750 66,516,750 Q3 payment of Q3 purchases 87,459,750 87,459,750 Q4 payment of Q3 purchases 51,365,250 51,365,250 Q4 payment of Q4 purchases 59,865,750 59,865,750 Total Payments by Quarter 79,616,250 160,017,000 153,976,500 111,231,000 504,840,750 Ending A/P Balance 35,159,250lew Zoom + Budget Seasonal C-4 Labor Budget Constant B-5 Labor Budget Seasonal C-5 Mfg. Overhead Constant B-6 Mfg. Overhead Seasonal C-6 Appendix B-6 Water Play, Inc. Manufacturing Overhead Budget--Part 2 January 1, 20XX Annual Year 2 Q1 Q2 Q3 04 Total Q1 Direct Labor Hours for Units Produced 1,620,000 1,620,000 1,620,000 1,620,000 6,480,000 VO/H Rate per DLH $ 53.24 $ 53.24 $ 53.24 $ 53.24 $ 53.24 Total Variable Overhead 86,250,000 86,250,000 86,250,000 86,250,000 345,000,000 Total Fixed Overhead 55,350,000 55,350,000 55,350,000 55,350,000 221,400,000 Total Overhead 141,600,000 141,600,000 141,600,000 141,600,000 566,400,000 Less: Depreciation 5,350,000 5,350,000 5,350,000 5,350,000 21,400,000 Cash Mfg. O/H costs 136,250,000 136,250,000 136,250,000 136,250,000 545,000,000