THE COMPANY IS AMAZON :) please answer all questions.
In your own words please!! do not copy and paste answer cheggs answer please!! Help would be greatly appreciated :)
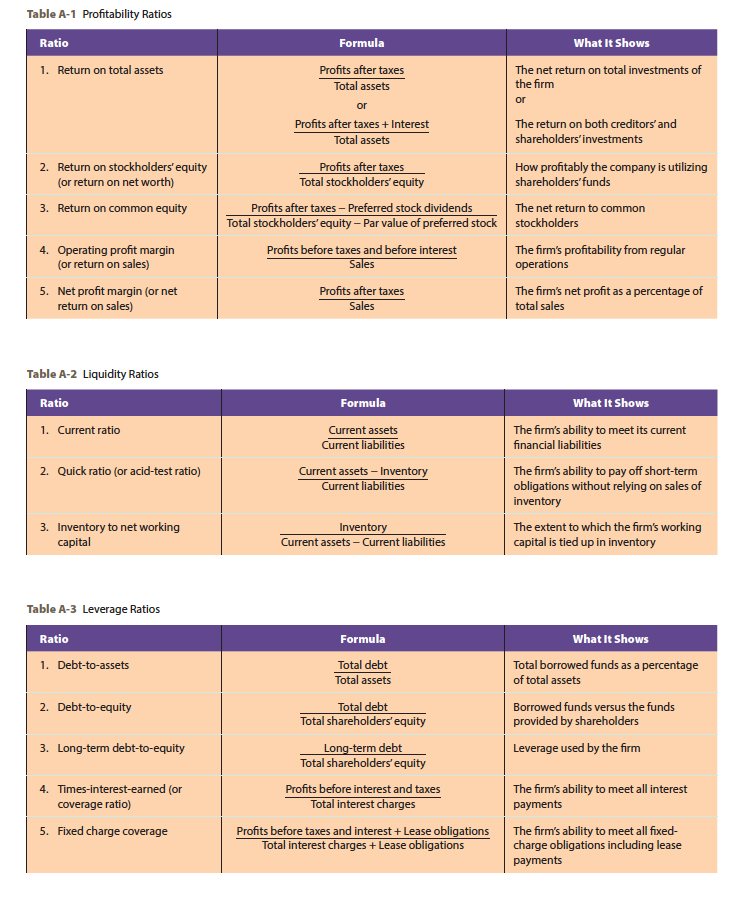
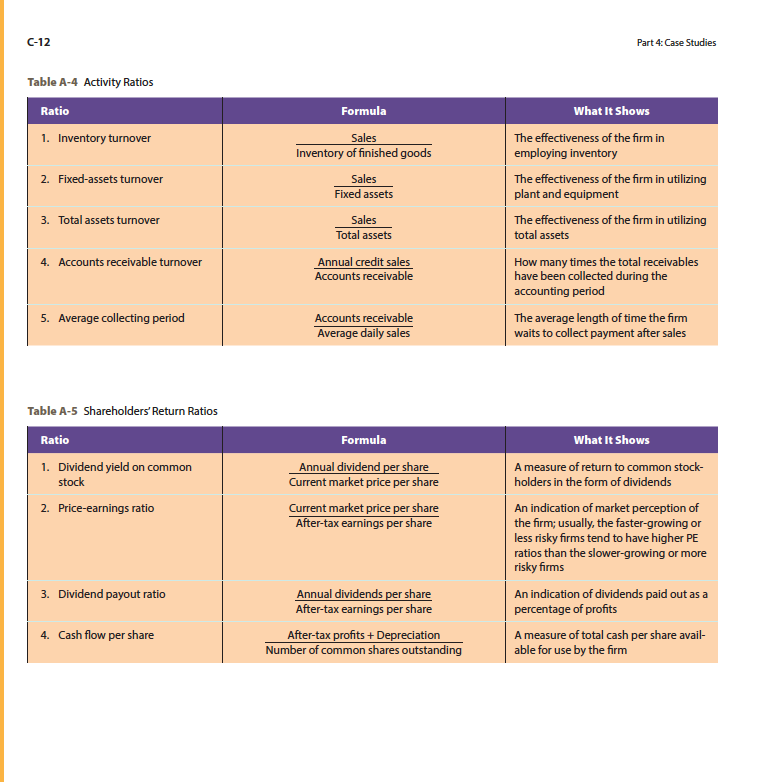
Refer to Tables A-1 through A-5 in Appendix II of the text for the operational definitions of and formulas for numerous common financial ratios, including profitability, liquidity, leverage, activity, and shareholders' return. Using these formulas, complete at least one ratio from each of the five categories, though you may apply as many of the ratios for which you can find the required information in the firm's financial reports. On your calculations page, specify for which formulas you are solving.
In an assessment of approximately 750 words, address the following:
- Determine which of the ratios provide the most key insights into the firm's current level of performance. How can you assess whether the results of your calculations are positive or negative? Explain which of the ratios give you reason to be concerned with the organization's current strategy and why.
- The Organizational and Operational Plans assignment references the possible benefits and risks of forming a strategic alliance. What would be the risks of forming a strategic alliance in terms of the firm's profitability ratios? Which of those five ratios is most likely to reveal immediate information for analysis of the alliance's effectiveness?
- Considering today's financial climate, how likely is it that the organization could acquire the capital necessary to support an aggressive value-enhancement strategy? From where would that capital originate? Compared to current interest rates, what do you believe is a realistic interest rate the firm might incur? Which of the liquidity ratios will be impacted by the influx of capital, if borrowed?
Submit your calculations as well please!!


Table A-1 Profitability Ratios Ratio 1. Return on total assets 2. Return on stockholders' equity (or return on net worth) 3. Return on common equity Formula What It Shows Profits after taxes The net return on total investments of Total assets the firm or or Profits after taxes + Interest The return on both creditors' and Total assets shareholders'investments Profits after taxes How profitably the company is utilizing Total stockholders' equity shareholders'funds Profits after taxes Preferred stock dividends The net return to common Total stockholders' equity - Par value of preferred stock stockholders Profits before taxes and before interest The firm's profitability from regular Sales operations Profits after taxes The firm's net profit as a percentage of Sales total sales 4. Operating profit margin (or return on sales) 5. Net profit margin (or net return on sales) Table A-2 Liquidity Ratios Ratio 1. Current ratio Formula Current assets Current liabilities Current assets Inventory Current liabilities 2. Quick ratio (or acid-test ratio) What It Shows The firm's ability to meet its current financial liabilities The firm's ability to pay off short-term obligations without relying on sales of inventory The extent to which the firm's working capital is tied up in inventory 3. Inventory to net working capital Inventory Current assets - Current liabilities Table A-3 Leverage Ratios Ratio 1. Debt-to-assets What It Shows Total borrowed funds as a percentage of total assets Borrowed funds versus the funds provided by shareholders Leverage used by the firm 2. Debt-to-equity Formula Total debt Total assets Total debt Total shareholders' equity Long-term debt Total shareholders' equity Profits before interest and taxes Total interest charges Profits before taxes and interest +Lease obligations Total interest charges + Lease obligations 3. Long-term debt-to-equity 4. Times-interest-earned (or coverage ratio) 5. Fixed charge coverage The firm's ability to meet all interest payments The firm's ability to meet all fixed- charge obligations including lease payments C-12 Part 4: Case Studies Table A-4 Activity Ratios Ratio 1. Inventory turnover 2. Fixed-assets turnover Formula Sales Inventory of finished goods Sales Fixed assets Sales Total assets 3. Total assets turnover What It Shows The effectiveness of the firm in employing inventory The effectiveness of the firm in utilizing plant and equipment The effectiveness of the firm in utilizing total assets How many times the total receivables have been collected during the accounting period The average length of time the firm waits to collect payment after sales 4. Accounts receivable turnover Annual credit sales Accounts receivable 5. Average collecting period Accounts receivable Average daily sales Table A-5 Shareholders' Return Ratios Ratio 1. Dividend yield on common stock 2. Price-earnings ratio Formula Annual dividend per share Current market price per share Current market price per share After-tax earnings per share What It Shows A measure of return to common stock- holders in the form of dividends An indication of market perception of the firm; usually, the faster-growing or less risky firms tend to have higher PE ratios than the slower-growing or more risky firms An indication of dividends paid out as a percentage of profits A measure of total cash per share avail- able for use by the firm 3. Dividend payout ratio Annual dividends per share After-tax earnings per share After-tax profits + Depreciation Number of common shares outstanding 4. Cash flow per share


