

Answered step by step
Verified Expert Solution
Question
1 Approved Answer
The company is Mc Donalds FINANCIAL ANALYSIS PROJECT ACCT 112 sp18 instructions-1 (2) Compatibility Mode Saved to this PC out References Mailings Review View Help
The company is Mc Donalds 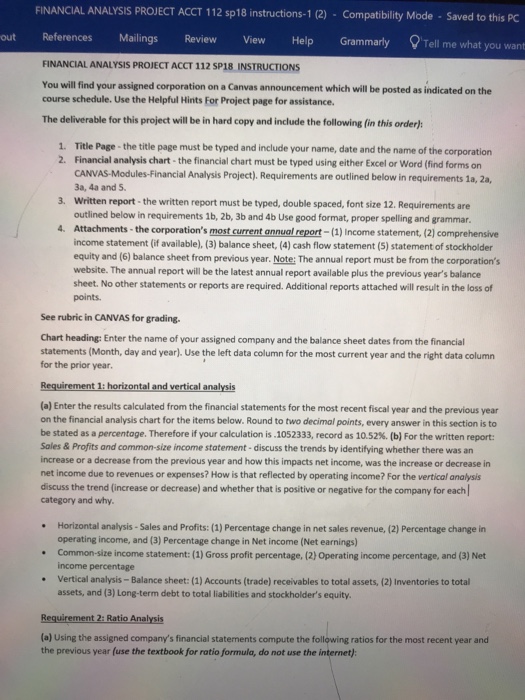
FINANCIAL ANALYSIS PROJECT ACCT 112 sp18 instructions-1 (2) Compatibility Mode Saved to this PC out References Mailings Review View Help Grammarly Tell me what you want FINANCIAL ANALYSIS PROJECT ACCT 112 SP18 INSTRUCTIONS You will find your assigned corporation on a Canvas announcement which will be posted as indicated on the course schedule. Use the Helpful Hints For Project page for assistance. The deliverable for this project will be in hard copy and include the following (in this order) Title Page- the title page must be typed and include your name, date and the name of the corporation Financial analysis chart-the financial chart must be typed using either Excel or Word (find forms on CANVAS-Modules-Financial Analysis Project). Requirements are outlined below in requirements 1a, 2a, 3a, 4a and 5. 1. 2. 3. Written report-the written report must be typed, double spaced, font size 12 Requirements are outlined below in requirements 1b, 2b, 3b and 4b Use good format, proper spelling and grammar . Attachments- the corporation's most current annual report-(1) Income statement, (2) comprehensive income statement (f available), (3) balance sheet, (4) cash flow statement (5) statement of stockholder equity and (6) balance sheet from previous year. Note: The annual report must be from the corporation's website. The annual report will be the latest annual report available plus the previous years balance sheet. No other statements or reports are required. Additional reports attached will result in the loss of points. See rubric in CANVAS for grading Chart heading: Enter the name of your assigned company and the balance sheet dates from the financial statements (Month, day and year). Use the left data column for the most current year and the right data column for the prior year. Requirement 1: horizontal and vertical analysis (a) Enter the results calculated from the financial statements for the most recent fiscal year and the previous year on the financial analysis chart for the items below. Round to two decimal points, every answer in this section is to be stated as a percentoge. Therefore if your calculation is. 1052333, record as 10.52%, (b) For the written report Sales & Profits and common-size income statement-discuss the trends by identifying whether there was an increase or a decrease from the previous year and how this impacts net income, was the increase or decrease in net income due to revenues or expenses? How is that reflected by operating income? For the vertical analysis discuss the trend (increase or decrease) and whether that is positive or negative for the company for each category and why. Horizontal analysis -Sales and Profits: (1) Percentage change in net sales revenue, (2) Percentage change in operating income, and (3) Percentage change in Net income (Net earnings) Common-size income statement: (1) Gross profit percentage, (2) Operating income percentage, and (3) Net income percentage Vertical analysis-Balance sheet: (1) Accounts (trade) receivables to total assets, (2) Inventories to total assets, and (3) Long-term debt to total liabilities and stockholder's equity Requirement 2: Ratio Analysis (a) Using the assigned company's financial statements compute the following ratios for the most recent year and the previous year (use the textbook for ratio formula, do not use the internet): FINANCIAL ANALYSIS PROJECT ACCT 112 sp18 instructions-1 (2) Compatibility Mode Saved to this PC out References Mailings Review View Help Grammarly Tell me what you want FINANCIAL ANALYSIS PROJECT ACCT 112 SP18 INSTRUCTIONS You will find your assigned corporation on a Canvas announcement which will be posted as indicated on the course schedule. Use the Helpful Hints For Project page for assistance. The deliverable for this project will be in hard copy and include the following (in this order) Title Page- the title page must be typed and include your name, date and the name of the corporation Financial analysis chart-the financial chart must be typed using either Excel or Word (find forms on CANVAS-Modules-Financial Analysis Project). Requirements are outlined below in requirements 1a, 2a, 3a, 4a and 5. 1. 2. 3. Written report-the written report must be typed, double spaced, font size 12 Requirements are outlined below in requirements 1b, 2b, 3b and 4b Use good format, proper spelling and grammar . Attachments- the corporation's most current annual report-(1) Income statement, (2) comprehensive income statement (f available), (3) balance sheet, (4) cash flow statement (5) statement of stockholder equity and (6) balance sheet from previous year. Note: The annual report must be from the corporation's website. The annual report will be the latest annual report available plus the previous years balance sheet. No other statements or reports are required. Additional reports attached will result in the loss of points. See rubric in CANVAS for grading Chart heading: Enter the name of your assigned company and the balance sheet dates from the financial statements (Month, day and year). Use the left data column for the most current year and the right data column for the prior year. Requirement 1: horizontal and vertical analysis (a) Enter the results calculated from the financial statements for the most recent fiscal year and the previous year on the financial analysis chart for the items below. Round to two decimal points, every answer in this section is to be stated as a percentoge. Therefore if your calculation is. 1052333, record as 10.52%, (b) For the written report Sales & Profits and common-size income statement-discuss the trends by identifying whether there was an increase or a decrease from the previous year and how this impacts net income, was the increase or decrease in net income due to revenues or expenses? How is that reflected by operating income? For the vertical analysis discuss the trend (increase or decrease) and whether that is positive or negative for the company for each category and why. Horizontal analysis -Sales and Profits: (1) Percentage change in net sales revenue, (2) Percentage change in operating income, and (3) Percentage change in Net income (Net earnings) Common-size income statement: (1) Gross profit percentage, (2) Operating income percentage, and (3) Net income percentage Vertical analysis-Balance sheet: (1) Accounts (trade) receivables to total assets, (2) Inventories to total assets, and (3) Long-term debt to total liabilities and stockholder's equity Requirement 2: Ratio Analysis (a) Using the assigned company's financial statements compute the following ratios for the most recent year and the previous year (use the textbook for ratio formula, do not use the internet) Step by Step Solution
There are 3 Steps involved in it
Step: 1

Get Instant Access to Expert-Tailored Solutions
See step-by-step solutions with expert insights and AI powered tools for academic success
Step: 2

Step: 3
Ace Your Homework with AI
Get the answers you need in no time with our AI-driven, step-by-step assistance
Get Started
ESG And Financial Performance The Effects Of Audit Quality And National Culture In The Nigerian And Kenyan Context
Authors: Ursule Yvanna Otek Ntsama
1st Edition
3346838838, 978-3346838834