Question
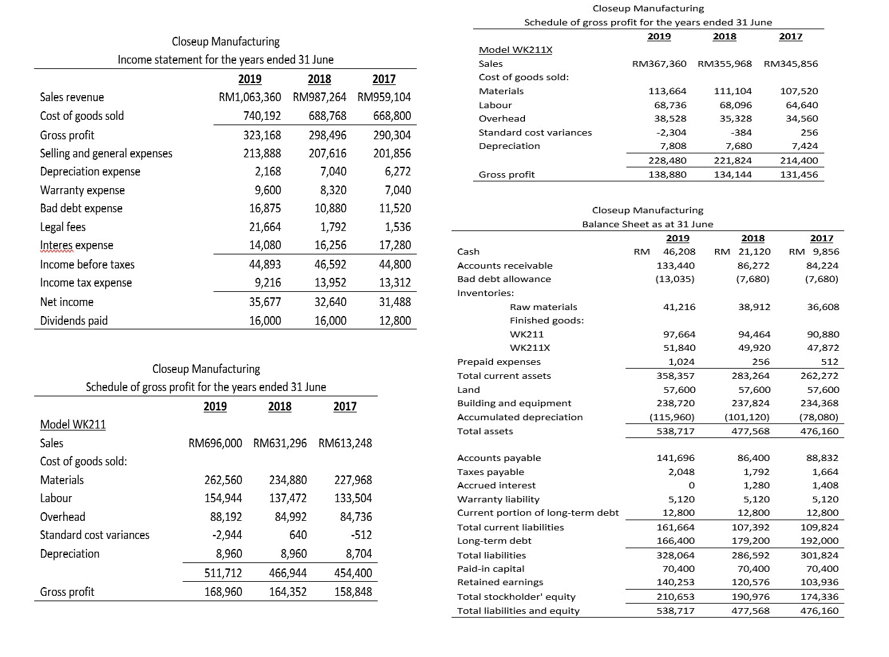
The company manufacturers two models of compacting machines for construction use,namely Model WK211 and Model WK211X. The audited financial statements for the years ended 31
The company manufacturers two models of compacting machines for construction use,namely Model WK211 and Model WK211X. The audited financial statements for the years ended 31 June 2017 and 2018, as well as the unaudited financial statements ended 31 June 2019, are presented above.
Supplementary information related to the company and its operation:
- All sales are on credit, with net 30 days term.
- A one-year warranty covering manufacturing defects is offered by the company.
- A periodic inventory system is used and year-end inventory is determined by a physical count on 31 June. The physical count for 2019 has been conducted on the planned date and was observed by the auditors. Various test counts have been executed by the auditors although additional audits test involving inventory has not been done.
- The average interest rate on all debt is 8%. Annual interest and principal payments are due each January. 1.
- The overhead standards shown exclude depreciation. The inventory carrying cost for finished goods was determined by adding a depreciation factor to the material-labour-overhead standard.
Required:
Examine the company?s financial statements. Determine the potential accounting issues or operational problems faced by the Closeup Manufacturing in the year ended 31 June 2019. For each issue or problem, report:
- The accounts with irregular balances and the reasoning of such evaluation.
- The possible causes that could have caused the irregularity.
- Specific elements of the business that should be given extra consideration during the 2019 audit.

Closeup Manufacturing Income statement for the years ended 31 June Sales revenue Cost of goods sold Gross profit Selling and general expenses Depreciation expense Warranty expense Bad debt expense Legal fees Interes expense Income before taxes Income tax expense Net income Dividends paid Model WK211 Sales Cost of goods sold: Materials Labour Overhead Standard cost variances Depreciation Gross profit 2019 2018 2017 RM1,063,360 RM987,264 RM959,104 740,192 688,768 668,800 323,168 290,304 213,888 201,856 2,168 6,272 9,600 7,040 16,875 11,520 21,664 1,536 14,080 17,280 44,893 46,592 44,800 9,216 13,952 13,312 31,488 12,800 35,677 16,000 298,496 207,616 7,040 8,320 10,880 1,792 16,256 Closeup Manufacturing Schedule of gross profit for the years ended 31 June 2019 2018 32,640 16,000 2017 RM696,000 RM631,296 RM613,248 262,560 234,880 227,968 154,944 137,472 133,504 88,192 84,992 84,736 -2,944 640 -512 8,960 8,960 8,704 511,712 466,944 168,960 164,352 454,400 158,848 Closeup Manufacturing Schedule of gross profit for the years ended 31 June 2019 2018 Model WK211X Sales Cost of goods sold: Materials Labour Overhead Standard cost variances Depreciation Gross profit Cash Accounts receivable Bad debt allowance Inventories: Raw materials Finished goods: WK211 WK211X Prepaid expenses Total current assets Land Building and equipment Accumulated depreciation Total assets Accounts payable Taxes payable Accrued interest Warranty liability Current portion of long-term debt Total current liabilities Long-term debt Total liabilities Paid-in capital Retained earnings Total stockholder' equity Total liabilities and equity RM367,360 RM355,968 RM345,856 113,664 68,736 38,528 -2,304 7,808 228,480 138,880 Closeup Manufacturing Balance Sheet as at 31 June 133,440 (13,035) 41,216 97,664 51,840 1,024 358,357 57,600 238,720 (115,960) 538,717 141,696 2,048 0 5,120 12,800 161,664 166,400 111,104 68,096 35,328 2019 2018 2017 RM 46,208 RM 21,120 RM 9,856 86,272 (7,680) 328,064 70,400 140,253 210,653 538,717 -384 7,680 221,824 134,144 38,912 94,464 49,920 256 283,264 57,600 237,824 (101,120) 477,568 86,400 1,792 1,280 5,120 12,800 107,392 179,200 2017 286,592 70,400 120,576 190,976 477,568 107,520 64,640 34,560 256 7,424 214,400 131,456 84,224 (7,680) 36,608 90,880 47,872 512 262,272 57,600 234,368 (78,080) 476,160 88,832 1,664 1,408 5,120 12,800 109,824 192,000 301,824 70,400 103,936 174,336 476,160
Step by Step Solution
3.47 Rating (147 Votes )
There are 3 Steps involved in it
Step: 1
Analysis of Collection from customers 2019 2018 Debtor Turnover Ratio Turnover Average Receivable 96...
Get Instant Access to Expert-Tailored Solutions
See step-by-step solutions with expert insights and AI powered tools for academic success
Step: 2

Step: 3

Ace Your Homework with AI
Get the answers you need in no time with our AI-driven, step-by-step assistance
Get Started


