

Question
The company, North S.L., has the following information in the Balance Sheet and Profit and Loss Account for 2016, before calculating its Corporate Tax Calculate
The company, North S.L., has the following information in the Balance Sheet and Profit and Loss Account for 2016, before calculating its Corporate Tax
- Calculate the liquidation of the Corporate Tax in a word document, using the following scheme.:
 Make in each of the following points the adjustment needed to obtain the tax base of the Corporate Tax, basing the response and establishing the amount that corresponds. You must also indicate if you are facing a temporary or permanent difference. In points 8 and 9 you should not propose any adjustment, in these two cases you should describe how they affect the liquidation of the Corporate Tax.
- North S.L. is thinking of making an international expansion. However, you need to determine whether to start big in a new market or expand into a potentially large market, but at a slower and safer pace. The options that the company's management has are:
- Enter the North American market, where it is known that their services can work, but they do not know in depth. They can enter through Canada and expand across the United States or vice versa.
- Open slowly but firmly in the Portuguese-speaking market. Due to its proximity, they know the Portuguese market perfectly, and this would allow North S.L. access to the Brazilian market, a country with a thriving economy.
To find out which option is more beneficial for North S.L., compare the possibilities that arise and justify which of the two is better, considering which country offers better fiscal conditions and that North S.L. seek the most significant benefit.
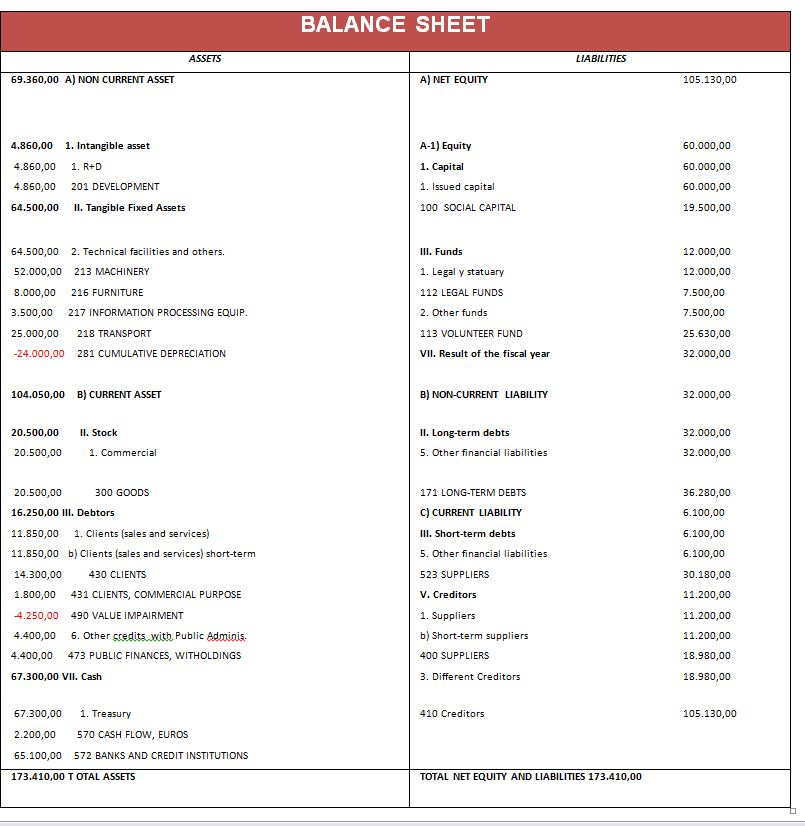
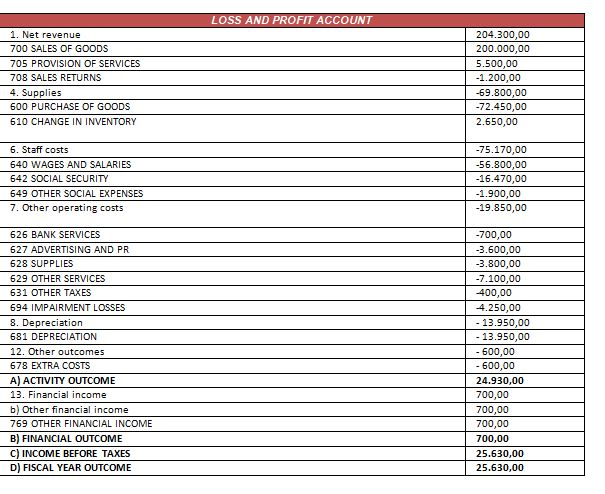
BALANCE SHEET ASSETS LIABILITIES 69.360,00 A) NON CURRENT ASSET A) NET EQUITY 105.130,00 4.860,00 1. Intangible asset 60.000,00 1. R+D 4.860,00 4.860,00 A-1) Equity 1. Capital 1. Issued capital 201 DEVELOPMENT 60.000,00 60.000,00 19.500,00 64.500,00 II. Tangible Fixed Assets 100 SOCIAL CAPITAL 64.500,00 2. Technical facilities and others. III. Funds 12.000,00 12.000,00 52.000,00 213 MACHINERY 8.000,00 216 FURNITURE 3.500,00 217 INFORMATION PROCESSING EQUIP. 25.000,00 218 TRANSPORT -24.000,00 281 CUMULATIVE DEPRECIATION 1. Legal y statuary 112 LEGAL FUNDS 2. Other funds 113 VOLUNTEER FUND VII. Result of the fiscal year 7.500,00 7.500,00 25.630,00 32.000,00 104.050,00 B) CURRENT ASSET B) NON-CURRENT LIABILITY 32.000,00 20.500,00 II. Stock II. Long-term debts 5. Other financial liabilities 32.000,00 32.000,00 20.500,00 1. Commercial 171 LONG-TERM DEBTS C) CURRENT LIABILITY 36.280,00 6.100,00 III. Short-term debts 6.100,00 6.100,00 20.500,00 300 GOODS 16.250,00 III. Debtors 11.850,00 1. Clients (sales and services) 11.850,00 b) Clients (sales and services) short-term 14.300,00 430 CLIENTS 1.800,00 431 CLIENTS, COMMERCIAL PURPOSE 4.250,00 490 VALUE IMPAIRMENT 4.400,00 6. Other credits with Public Adminis. 4.400,00 473 PUBLIC FINANCES, WITHOLDINGS 5. Other financial liabilities 523 SUPPLIERS 30.180,00 V. Creditors 11.200,00 1. Suppliers b) Short-term suppliers 400 SUPPLIERS 11.200,00 11.200,00 18.980,00 67.300,00 VII. Cash 3. Different Creditors 18.980,00 410 Creditors 105.130,00 67.300,00 1. Treasury 2.200,00 570 CASH FLOW, EUROS 65.100,00 572 BANKS AND CREDIT INSTITUTIONS 173.410,00 TOTAL ASSETS TOTAL NET EQUITY AND LIABILITIES 173.410,00 LOSS AND PROFIT ACCOUNT 1. Net revenue 700 SALES OF GOODS 705 PROVISION OF SERVICES 708 SALES RETURNS 4. Supplies 600 PURCHASE OF GOODS 610 CHANGE IN INVENTORY 204.300,00 200.000,00 5.500,00 -1.200,00 -69.800,00 -72.450,00 2.650,00 6. Staff costs 640 WAGES AND SALARIES 642 SOCIAL SECURITY 649 OTHER SOCIAL EXPENSES 7. Other operating costs -75.170,00 -56.800,00 -16.470,00 -1.900,00 -19.850,00 626 BANK SERVICES 627 ADVERTISING AND PR 628 SUPPLIES 629 OTHER SERVICES 631 OTHER TAXES 694 IMPAIRMENT LOSSES 8. Depreciation 681 DEPRECIATION 12. Other outcomes 678 EXTRA COSTS A) ACTIVITY OUTCOME 13. Financial income b) Other financial income 769 OTHER FINANCIAL INCOME B) FINANCIAL OUTCOME C) INCOME BEFORE TAXES D) FISCAL YEAR OUTCOME -700,00 3.600,00 -3.800,00 -7.100,00 -400,00 4.250,00 - 13.950,00 - 13.950,00 - 600,00 - 600,00 24.930,00 700,00 700,00 700,00 700,00 25.630,00 25.630,00 BALANCE SHEET ASSETS LIABILITIES 69.360,00 A) NON CURRENT ASSET A) NET EQUITY 105.130,00 4.860,00 1. Intangible asset 60.000,00 1. R+D 4.860,00 4.860,00 A-1) Equity 1. Capital 1. Issued capital 201 DEVELOPMENT 60.000,00 60.000,00 19.500,00 64.500,00 II. Tangible Fixed Assets 100 SOCIAL CAPITAL 64.500,00 2. Technical facilities and others. III. Funds 12.000,00 12.000,00 52.000,00 213 MACHINERY 8.000,00 216 FURNITURE 3.500,00 217 INFORMATION PROCESSING EQUIP. 25.000,00 218 TRANSPORT -24.000,00 281 CUMULATIVE DEPRECIATION 1. Legal y statuary 112 LEGAL FUNDS 2. Other funds 113 VOLUNTEER FUND VII. Result of the fiscal year 7.500,00 7.500,00 25.630,00 32.000,00 104.050,00 B) CURRENT ASSET B) NON-CURRENT LIABILITY 32.000,00 20.500,00 II. Stock II. Long-term debts 5. Other financial liabilities 32.000,00 32.000,00 20.500,00 1. Commercial 171 LONG-TERM DEBTS C) CURRENT LIABILITY 36.280,00 6.100,00 III. Short-term debts 6.100,00 6.100,00 20.500,00 300 GOODS 16.250,00 III. Debtors 11.850,00 1. Clients (sales and services) 11.850,00 b) Clients (sales and services) short-term 14.300,00 430 CLIENTS 1.800,00 431 CLIENTS, COMMERCIAL PURPOSE 4.250,00 490 VALUE IMPAIRMENT 4.400,00 6. Other credits with Public Adminis. 4.400,00 473 PUBLIC FINANCES, WITHOLDINGS 5. Other financial liabilities 523 SUPPLIERS 30.180,00 V. Creditors 11.200,00 1. Suppliers b) Short-term suppliers 400 SUPPLIERS 11.200,00 11.200,00 18.980,00 67.300,00 VII. Cash 3. Different Creditors 18.980,00 410 Creditors 105.130,00 67.300,00 1. Treasury 2.200,00 570 CASH FLOW, EUROS 65.100,00 572 BANKS AND CREDIT INSTITUTIONS 173.410,00 TOTAL ASSETS TOTAL NET EQUITY AND LIABILITIES 173.410,00 LOSS AND PROFIT ACCOUNT 1. Net revenue 700 SALES OF GOODS 705 PROVISION OF SERVICES 708 SALES RETURNS 4. Supplies 600 PURCHASE OF GOODS 610 CHANGE IN INVENTORY 204.300,00 200.000,00 5.500,00 -1.200,00 -69.800,00 -72.450,00 2.650,00 6. Staff costs 640 WAGES AND SALARIES 642 SOCIAL SECURITY 649 OTHER SOCIAL EXPENSES 7. Other operating costs -75.170,00 -56.800,00 -16.470,00 -1.900,00 -19.850,00 626 BANK SERVICES 627 ADVERTISING AND PR 628 SUPPLIES 629 OTHER SERVICES 631 OTHER TAXES 694 IMPAIRMENT LOSSES 8. Depreciation 681 DEPRECIATION 12. Other outcomes 678 EXTRA COSTS A) ACTIVITY OUTCOME 13. Financial income b) Other financial income 769 OTHER FINANCIAL INCOME B) FINANCIAL OUTCOME C) INCOME BEFORE TAXES D) FISCAL YEAR OUTCOME -700,00 3.600,00 -3.800,00 -7.100,00 -400,00 4.250,00 - 13.950,00 - 13.950,00 - 600,00 - 600,00 24.930,00 700,00 700,00 700,00 700,00 25.630,00 25.630,00
Step by Step Solution
There are 3 Steps involved in it
Step: 1

Get Instant Access to Expert-Tailored Solutions
See step-by-step solutions with expert insights and AI powered tools for academic success
Step: 2

Step: 3
Ace Your Homework with AI
Get the answers you need in no time with our AI-driven, step-by-step assistance
Get Started
Horngren S Financial And Managerial Accounting The Managerial Chapters RENTAL EDITION
Authors: Miller-Nobles
1st Edition
0136503748, 978-0136503743