The Company uses a variety of sources of long-term capital including common stock, redeemable preferred stock units and limited partnership interests. The preferred stock is sold as units consisting of a share of the preferred stock and a warrant to purchase 20 shares of the Companys common shares exercisable over a four year period. There is no secondary market for the preferred stock units.
Your analysis should include an examination of the financial statements and the business environment in which the Company operates. Additionally, through a comprehensive analysis of the various financial and other ratios you should decide if the preferred units are an attractive investment.
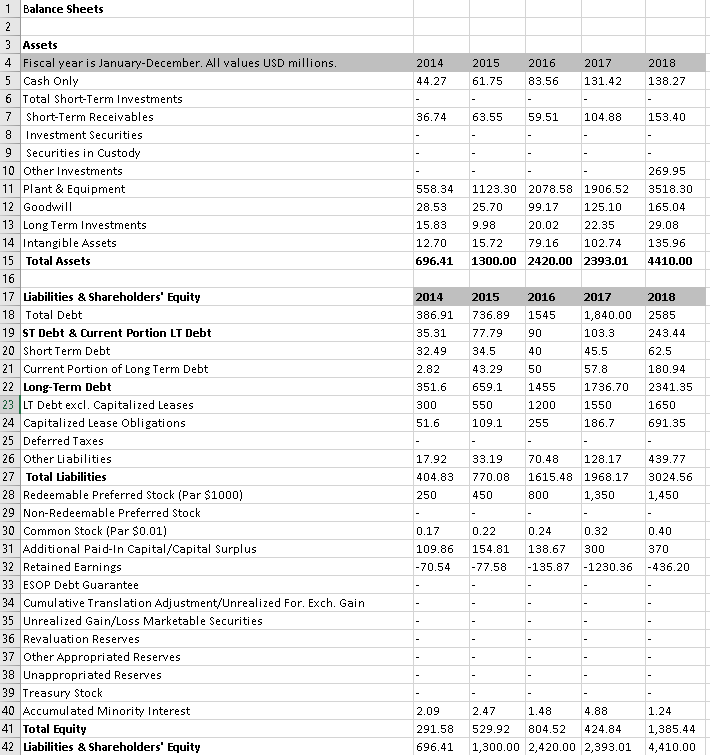
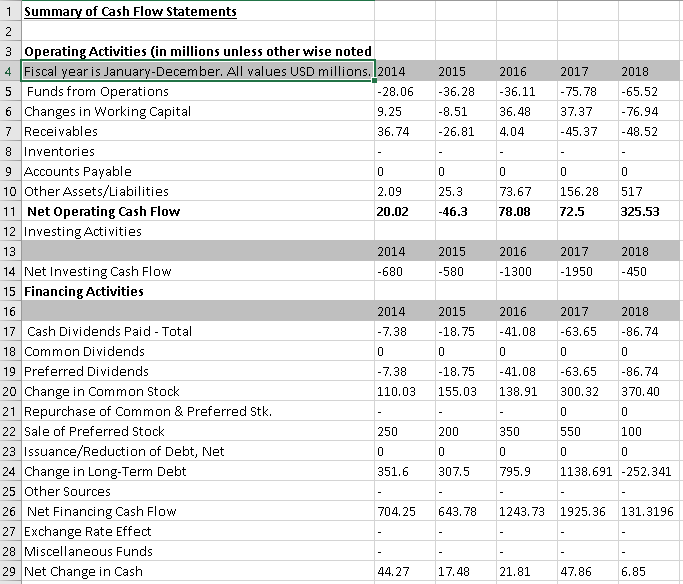
In particular, your analysis should include the following items: *** Calculate and analyze the following categories of the financial ratios for the past three years using the attached financial statements:*** A- Profitability Analysis 1.Return on Assets (ROA) 2. Return on Common Equity (ROCE) 3. Return on Net Operating Assets (RNOA) B. Risk Analysis 1. Coverage Analysis Times Interest Earned Ratio, EBITDA Ratio, and Cash from Operations to Total Debt 2. Short-term Liquidity Current ratio, Quick ratio, and Working Capital 3. Longer-term Solvency Liabilities-to-Equity, Total Debt-to-Equity, and Financial Leverage
4- Calculate Z Score, a Bankruptcy Prediction Indicator for the most recent year. Show your Calculations to indicate the formulas and calculations. Offer your Analysis to identify the underlying trend and changes, compare with the prior years (horizontally) and the industry benchmarks (horizontally and vertically.) See the attached financial statements in Excel. All numbers provided are hypothetical. Pease only use what is provided for your calculations. The statutory tax rate is 37%. The current market prices per share for the preferred stock is $1000 and common stock is $1.
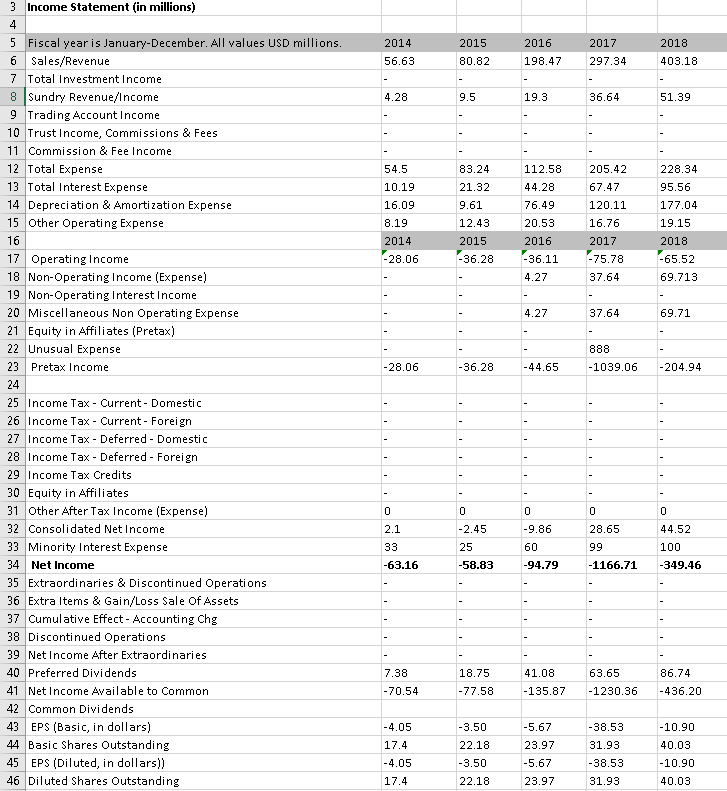
3 Income Statement (in millions) 2014 56.63 2015 80.82 2016 198.47 2017 297.34 2018 403.18 4.28 9.5 19.3 36.64 51.39 5 Fiscal year is January-December. All values USD millions. 6 Sales/Revenue 7 Total Investment Income 8 Sundry Revenue/Income 9 Trading Account Income 10 Trust Income, Commissions & Fees 11 Commission & Fee Income 12 Total Expense 13 Total Interest Expense 14 Depreciation & Amortization Expense 15 Other Operating Expense 16 17 Operating Income 18 Non-Operating Income (Expense) 19 Non-Operating Interest Income 20 Miscellaneous Non Operating Expense 21 Equity in Affiliates (Pretax) 22 Unusual Expense 23 Pretax Income 54.5 10.19 16.09 8.19 2014 -28.06 83.24 21.32 9.61 12.43 2015 -36.28 112.58 44.28 76.49 20.53 2016 -36.11 4.27 205.42 67.47 120.11 16.76 2017 -75.78 37.64 228.34 95.56 177.04 19.15 2018 -65.52 69.713 4.27 37.64 69.71 888 -1039.06 -28.06 -36.28 -44.65 -204.94 O 0 -9.86 2.1 -2.45 28.65 33 99 60 -94.79 44.52 100 -349.46 -63.16 -58.83 -1166.71 25 Income Tax - Current - Domestic 26 Income Tax - Current - Foreign 27 Income Tax - Deferred - Domestic 28 Income Tax - Deferred - Foreign 29 Income Tax Credits 30 Equity in Affiliates 31 Other After Tax Income (Expense) 32 Consolidated Net Income 33 Minority Interest Expense 34 Net Income 35 Extraordinaries & Discontinued Operations 36 Extra Items & Gain/Loss Sale Of Assets 37 Cumulative Effect - Accounting Chg 38 Discontinued Operations 39 Net Income After Extraordinaries 40 Preferred Dividends 41 Net Income Available to Common 42 Common Dividends 43 EPS (Basic, in dollars) 44 Basic Shares Outstanding 45 EPS (Diluted, in dollars)) 46 Diluted Shares Outstanding 7.38 -70.54 18.75 -77.58 41.08 -135.87 63.65 -1230.36 86.74 -436.20 -4.05 17.4 -4.05 17.4 -3.50 22.18 -3.50 22.18 -5.67 23.97 -5.67 23.97 -38.53 31.93 -38.53 31.93 -10.90 40.03 -10.90 40.03 1 Balance Sheets 2014 44.27 2015 2016 61.7583.56 2017 131.42 2018 138.27 36.74 63.55 59.51 104.88 153.40 558.34 28.53 15.83 12.70 696.41 1123.30 2078.58 1906.52 25.70 99.17 125.10 9.98 20.02 22.35 15.7279.16 102.74 1300.00 2420.00 2393.01 269.95 3518.30 165.04 29.08 135.96 4410.00 62.3 3 Assets 4 Fiscal year is January-December. All values USD millions. 5 Cash Only 6 Total Short-Term Investments 7 Short-Term Receivables 8 Investment Securities 9 Securities in Custody 10 Other Investments 11 Plant & Equipment 12 Goodwill 13 Long Term Investments 14 Intangible Assets 15 Total Assets 16 17 Liabilities & Shareholders' Equity 18 Total Debt 19 ST Debt & Current Portion LT Debt 20 Short Term Debt 21 Current Portion of Long Term Debt 22 Long-Term Debt 23 LT Debt excl. Capitalized Leases 24 Capitalized Lease Obligations 25 Deferred Taxes 26 Other Liabilities 27 Total Liabilities 28 Redeemable Preferred Stock (Par $1000) 29 Non-Redeemable Preferred Stock 30 Common Stock (Par $0.01) 31 Additional Paid-In Capital/Capital Surplus 32 Retained Earnings 33 ESOP Debt Guarantee 34 Cumulative Translation Adjustment/Unrealized For, Exch. Gain 35 Unrealized Gain/Loss Marketable Securities 36 Revaluation Reserves 37 Other Appropriated Reserves 38 Unappropriated Reserves 39 Treasury Stock 40 Accumulated Minority Interest 41 Total Equity 42 Liabilities & Shareholders' Equity 2014 386.91 35.31 32.49 2.82 351.6 300 51.6 2015 2016 736.89 1545 77.79 90 34.5 40 43.2950 659.1 1455 550 1200 109.1 255 2017 1,840.00 103.3 45.5 57.8 1736.70 1550 186.7 2018 2585 243.44 62.5 180.94 2341.35 1650 691.35 17.92 404.83 250 33.1970.48 128.17 770.08 1615.48 1968.17 450 800 1,350 439.77 3024.56 1,450 0.17 109.86 -70.54 0.22 154.81 -77.58 0.24 138.67 -135.87 0.32 300 -1230.36 0.40 370 -436.20 2.09 291.58 696.41 2.47 1 .48 4.88 529.92 804.52 424.84 1,300.00 2,420.00 2,393.01 1.24 1,385.44 4,410.00 1 Summary of Cash Flow Statements 2015 -36.28 -8.51 -26.81 2016 -36.11 36.48 4.04 2017 -75.78 37.37 -45.37 2018 -65.52 -76.94 -48.52 0 25.3 -46.3 0 73.67 78.08 0 156.28 72.5 517 325.53 2015 -580 2016 -1300 2017 -1950 2018 -450 3 Operating Activities (in millions unless otherwise noted 4 Fiscal year is January-December. All values USD millions. 2014 5 Funds from Operations -28.06 6 Changes in Working Capital 9.25 7 Receivables 36.74 8 Inventories 9 Accounts Payable 0 10 Other Assets/Liabilities 2.09 11 Net Operating Cash Flow 20.02 12 Investing Activities 2014 14 Net Investing Cash Flow -680 15 Financing Activities 16 2014 17 Cash Dividends Paid - Total -7.38 18 Common Dividends 19 Preferred Dividends -7.38 20 Change in Common Stock 110.03 21 Repurchase of common & Preferred Stk. 22 Sale of Preferred Stock 250 23 Issuance/Reduction of Debt, Net 24 Change in Long-Term Debt 351.6 25 Other Sources 26 Net Financing Cash Flow 704.25 27 Exchange Rate Effect 28 Miscellaneous Funds 29 Net Change in Cash 44.27 2015 -18.75 2016 -41.08 2017 -63.65 2018 -86.74 -18.75 155.03 -41.08 138.91 - 350 -63.65 300.32 0 550 -86.74 370.40 0 100 200 0 307.5 795.9 1138.691 -252.341 643.78 1243.73 1925.36 131.3196 17.48 21.81 47.86 6.85 3 Income Statement (in millions) 2014 56.63 2015 80.82 2016 198.47 2017 297.34 2018 403.18 4.28 9.5 19.3 36.64 51.39 5 Fiscal year is January-December. All values USD millions. 6 Sales/Revenue 7 Total Investment Income 8 Sundry Revenue/Income 9 Trading Account Income 10 Trust Income, Commissions & Fees 11 Commission & Fee Income 12 Total Expense 13 Total Interest Expense 14 Depreciation & Amortization Expense 15 Other Operating Expense 16 17 Operating Income 18 Non-Operating Income (Expense) 19 Non-Operating Interest Income 20 Miscellaneous Non Operating Expense 21 Equity in Affiliates (Pretax) 22 Unusual Expense 23 Pretax Income 54.5 10.19 16.09 8.19 2014 -28.06 83.24 21.32 9.61 12.43 2015 -36.28 112.58 44.28 76.49 20.53 2016 -36.11 4.27 205.42 67.47 120.11 16.76 2017 -75.78 37.64 228.34 95.56 177.04 19.15 2018 -65.52 69.713 4.27 37.64 69.71 888 -1039.06 -28.06 -36.28 -44.65 -204.94 O 0 -9.86 2.1 -2.45 28.65 33 99 60 -94.79 44.52 100 -349.46 -63.16 -58.83 -1166.71 25 Income Tax - Current - Domestic 26 Income Tax - Current - Foreign 27 Income Tax - Deferred - Domestic 28 Income Tax - Deferred - Foreign 29 Income Tax Credits 30 Equity in Affiliates 31 Other After Tax Income (Expense) 32 Consolidated Net Income 33 Minority Interest Expense 34 Net Income 35 Extraordinaries & Discontinued Operations 36 Extra Items & Gain/Loss Sale Of Assets 37 Cumulative Effect - Accounting Chg 38 Discontinued Operations 39 Net Income After Extraordinaries 40 Preferred Dividends 41 Net Income Available to Common 42 Common Dividends 43 EPS (Basic, in dollars) 44 Basic Shares Outstanding 45 EPS (Diluted, in dollars)) 46 Diluted Shares Outstanding 7.38 -70.54 18.75 -77.58 41.08 -135.87 63.65 -1230.36 86.74 -436.20 -4.05 17.4 -4.05 17.4 -3.50 22.18 -3.50 22.18 -5.67 23.97 -5.67 23.97 -38.53 31.93 -38.53 31.93 -10.90 40.03 -10.90 40.03 1 Balance Sheets 2014 44.27 2015 2016 61.7583.56 2017 131.42 2018 138.27 36.74 63.55 59.51 104.88 153.40 558.34 28.53 15.83 12.70 696.41 1123.30 2078.58 1906.52 25.70 99.17 125.10 9.98 20.02 22.35 15.7279.16 102.74 1300.00 2420.00 2393.01 269.95 3518.30 165.04 29.08 135.96 4410.00 62.3 3 Assets 4 Fiscal year is January-December. All values USD millions. 5 Cash Only 6 Total Short-Term Investments 7 Short-Term Receivables 8 Investment Securities 9 Securities in Custody 10 Other Investments 11 Plant & Equipment 12 Goodwill 13 Long Term Investments 14 Intangible Assets 15 Total Assets 16 17 Liabilities & Shareholders' Equity 18 Total Debt 19 ST Debt & Current Portion LT Debt 20 Short Term Debt 21 Current Portion of Long Term Debt 22 Long-Term Debt 23 LT Debt excl. Capitalized Leases 24 Capitalized Lease Obligations 25 Deferred Taxes 26 Other Liabilities 27 Total Liabilities 28 Redeemable Preferred Stock (Par $1000) 29 Non-Redeemable Preferred Stock 30 Common Stock (Par $0.01) 31 Additional Paid-In Capital/Capital Surplus 32 Retained Earnings 33 ESOP Debt Guarantee 34 Cumulative Translation Adjustment/Unrealized For, Exch. Gain 35 Unrealized Gain/Loss Marketable Securities 36 Revaluation Reserves 37 Other Appropriated Reserves 38 Unappropriated Reserves 39 Treasury Stock 40 Accumulated Minority Interest 41 Total Equity 42 Liabilities & Shareholders' Equity 2014 386.91 35.31 32.49 2.82 351.6 300 51.6 2015 2016 736.89 1545 77.79 90 34.5 40 43.2950 659.1 1455 550 1200 109.1 255 2017 1,840.00 103.3 45.5 57.8 1736.70 1550 186.7 2018 2585 243.44 62.5 180.94 2341.35 1650 691.35 17.92 404.83 250 33.1970.48 128.17 770.08 1615.48 1968.17 450 800 1,350 439.77 3024.56 1,450 0.17 109.86 -70.54 0.22 154.81 -77.58 0.24 138.67 -135.87 0.32 300 -1230.36 0.40 370 -436.20 2.09 291.58 696.41 2.47 1 .48 4.88 529.92 804.52 424.84 1,300.00 2,420.00 2,393.01 1.24 1,385.44 4,410.00 1 Summary of Cash Flow Statements 2015 -36.28 -8.51 -26.81 2016 -36.11 36.48 4.04 2017 -75.78 37.37 -45.37 2018 -65.52 -76.94 -48.52 0 25.3 -46.3 0 73.67 78.08 0 156.28 72.5 517 325.53 2015 -580 2016 -1300 2017 -1950 2018 -450 3 Operating Activities (in millions unless otherwise noted 4 Fiscal year is January-December. All values USD millions. 2014 5 Funds from Operations -28.06 6 Changes in Working Capital 9.25 7 Receivables 36.74 8 Inventories 9 Accounts Payable 0 10 Other Assets/Liabilities 2.09 11 Net Operating Cash Flow 20.02 12 Investing Activities 2014 14 Net Investing Cash Flow -680 15 Financing Activities 16 2014 17 Cash Dividends Paid - Total -7.38 18 Common Dividends 19 Preferred Dividends -7.38 20 Change in Common Stock 110.03 21 Repurchase of common & Preferred Stk. 22 Sale of Preferred Stock 250 23 Issuance/Reduction of Debt, Net 24 Change in Long-Term Debt 351.6 25 Other Sources 26 Net Financing Cash Flow 704.25 27 Exchange Rate Effect 28 Miscellaneous Funds 29 Net Change in Cash 44.27 2015 -18.75 2016 -41.08 2017 -63.65 2018 -86.74 -18.75 155.03 -41.08 138.91 - 350 -63.65 300.32 0 550 -86.74 370.40 0 100 200 0 307.5 795.9 1138.691 -252.341 643.78 1243.73 1925.36 131.3196 17.48 21.81 47.86 6.85