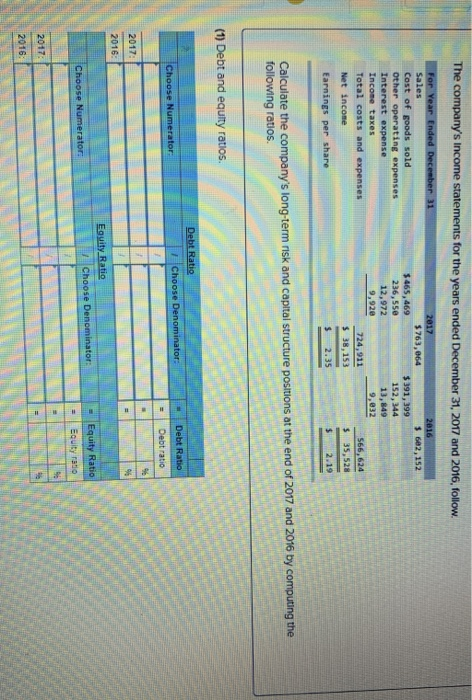
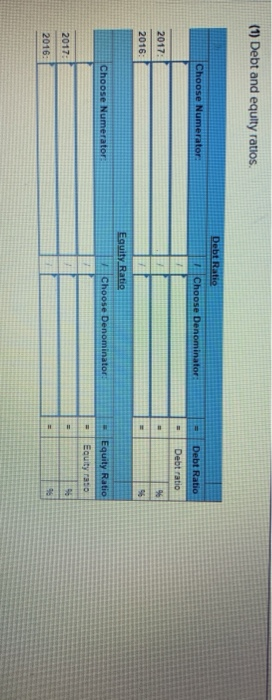
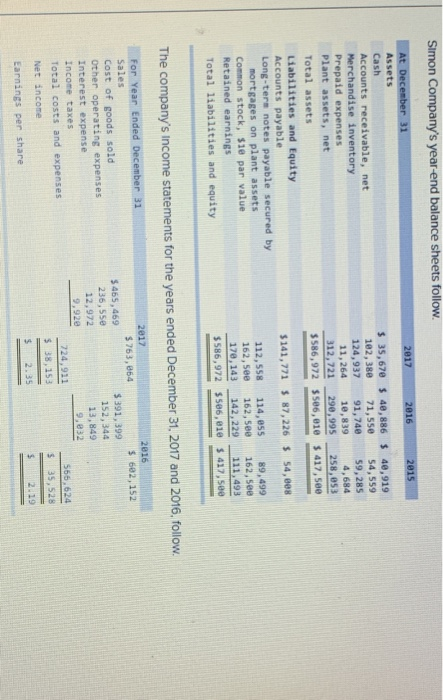
The company's Income statements for the years ended December 31, 2017 and 2016, follow For Year Ended December 31 2017 2016 Sales $763,064 $ 6e2,152 Cost of goods sold Other operating expenses $465,469 236,550 12,972 $391,399 152, 344 13,849 9,032 Interest expense Income taxes 9,92e Total costs and expenses 724,911 $66,624 Net income $ 38,153 S 35,528 Earnings per share 2.35 2.19 Calculate the company's long-term risk and capital structure positions at the end of 2017 and 2016 by computing the following ratios. (1) Debt and equity ratios Debt Ratio Choose Denominator: Debt Ratio Choose Numerator Debt ratio 2017 2016 Equity Ratio Choose Denominator: Equity Ratio Choose Numerator: Equity ratio 2017 2016 (1) Debt and equlty ratios Debt Ratio Choose Numerator Choose Denominator: Debt Ratio Debt ratio 46 2017: 2016: 96 Equity Ratio Choose Numerator ElChoose Denominator: Equity Ratio Equity raso 6 2017: 6 2016: Simon Company's year-end balance sheets follow At December 31 2817 2816 2015 Assets Cash Accounts receivable, net Merchandise inventory Prepaid expenses Plant assets, net $ 35,670 $ 40,886 $ 40,919 54,559 59,285 4,684 258,053 102, 380 71,55e 91,740 124,937 11,264 312,721 10,839 290,995 se6, 01e s 417,50e Total assets $586,972 Liabilities and Equity Accounts payable Long-ters notes payable secured by mortgages on plant assets Common stock, $1e par value Retained earnings $141,771 87,226 $ 54, ees 114,ess 162,5ee 142,229 112,558 89,499 162,see 17e,143 162,see 111.493 Total liabilities and equity $586,972 $586,e10 $ 417,58e The company's Income statements for the years ended December 31, 2017 and 2016, follow. For Year Ended December 31 2817 2816 Sales $763,864 $ 602,152 Cost of goods sold Other operating expenses $465,469 $ 391,399 152,344 236.55e Interest expense 12,972 13,849 9,920 9,832 Income taxes Total costs and expenses 724,911 566,624 S38,153 $ 35,528) Net income 2.35 2.19 Earnings per share