

Question
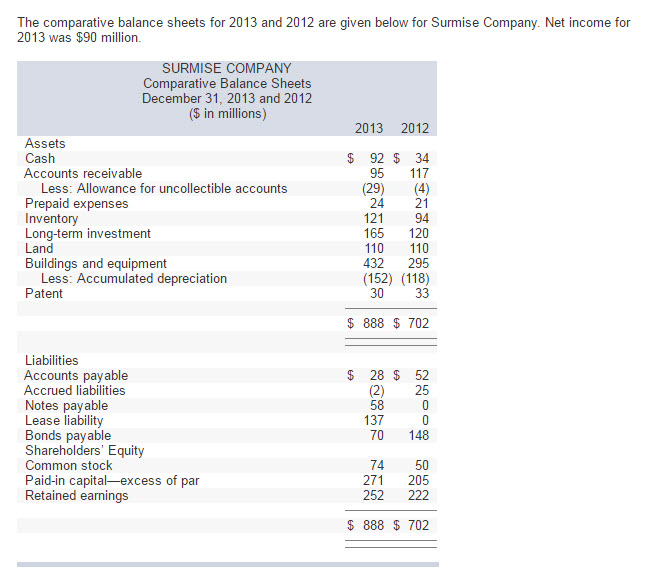
The comparative balance sheets for 2013 and 2012 are given below for Surmise Company. Net income for 2013 was $90 million. SURMISE COMPANY Comparative Balance
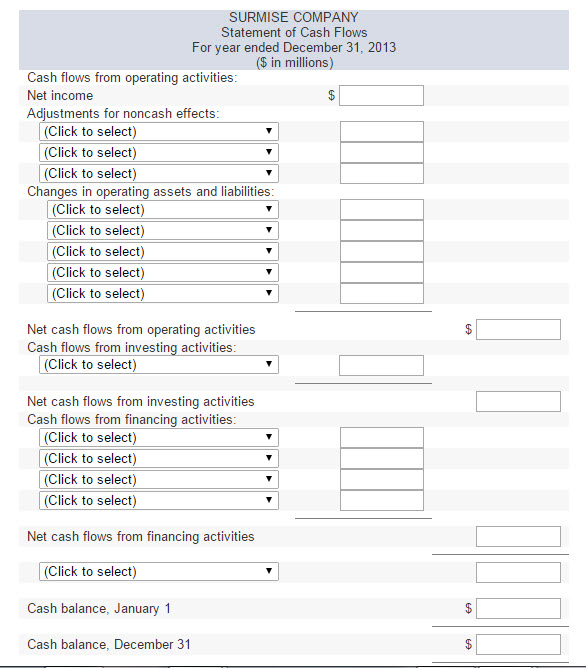
The comparative balance sheets for 2013 and 2012 are given below for Surmise Company. Net income for 2013 was $90 million. SURMISE COMPANY Comparative Balance Sheets December 31, 2013 and 2012 ($ in millions) 2013 2012 Assets Cash $ 92 $ 34 Accounts receivable 95 117 Less: Allowance for uncollectible accounts (29) (4) Prepaid expenses 24 21 Inventory 121 94 Long-term investment 165 120 Land 110 110 Buildings and equipment 432 295 Less: Accumulated depreciation (152) (118) Patent 30 33 $ 888 $ 702 Liabilities Accounts payable $ 28 $ 52 Accrued liabilities (2) 25 Notes payable 58 0 Lease liability 137 0 Bonds payable 70 148 Shareholders Equity Common stock 74 50 Paid-in capitalexcess of par 271 205 Retained earnings 252 222 $ 888 $ 702 Required: Prepare the statement of cash flows of Surmise Company for the year ended December 31, 2013. Use the indirect method to present cash flows from operating activities because you do not have sufficient information to use the direct method. You will need to make reasonable assumptions concerning the reasons for changes in some account balances. A spreadsheet or T-account analysis will be helpful. (Enter your answers in millions. Amounts to be deducted should be indicated with a minus sign.) Required: Prepare the statement of cash flows of Surmise Company for the year ended December 31, 2013. Use the indirect method to present cash flows from operating activities because you do not have sufficient information to use the direct method. You will need to make reasonable assumptions concerning the reasons for changes in some account balances. A spreadsheet or T-account analysis will be helpful. (Enter your answers in millions. Amounts to be deducted should be indicated with a minus sign.)
Step by Step Solution
There are 3 Steps involved in it
Step: 1

Get Instant Access to Expert-Tailored Solutions
See step-by-step solutions with expert insights and AI powered tools for academic success
Step: 2

Step: 3
Ace Your Homework with AI
Get the answers you need in no time with our AI-driven, step-by-step assistance
Get Started
Final Work On Internal Audit Internal Audit And Its Management
Authors: Silvia Mamani
1st Edition
6203099651, 978-6203099652