Question
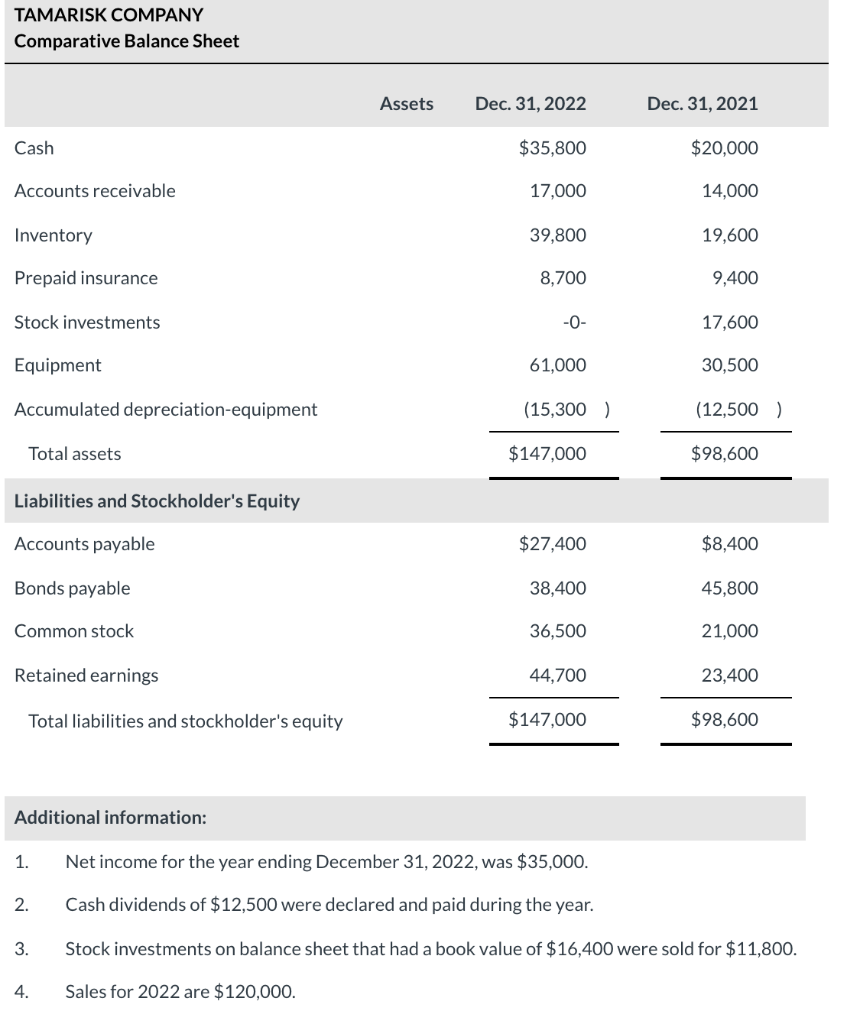
The comparative balance sheets for Tamarisk Company appear below: TAMARISK COMPANY Comparative Balance Sheet Assets Dec. 31, 2022 Dec. 31, 2021 Cash $35,800 $20,000 Accounts

 The comparative balance sheets for Tamarisk Company appear below: TAMARISK COMPANY Comparative Balance Sheet Assets Dec. 31, 2022 Dec. 31, 2021 Cash $35,800 $20,000 Accounts receivable 17,000 14,000 Inventory 39,800 19,600 Prepaid insurance 8,700 9,400 Stock investments -0- 17,600 Equipment 61,000 30,500 Accumulated depreciation-equipment (15,300 ) (12,500 ) Total assets $147,000 $98,600 Liabilities and Stockholder's Equity Accounts payable $27,400 $8,400 Bonds payable 38,400 45,800 Common stock 36,500 21,000 Retained earnings 44,700 23,400 Total liabilities and stockholder's equity $147,000 $98,600
Step by Step Solution
There are 3 Steps involved in it
Step: 1

Get Instant Access to Expert-Tailored Solutions
See step-by-step solutions with expert insights and AI powered tools for academic success
Step: 2

Step: 3

Ace Your Homework with AI
Get the answers you need in no time with our AI-driven, step-by-step assistance
Get Started


