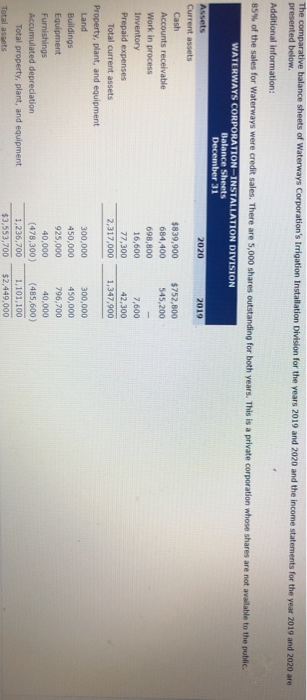
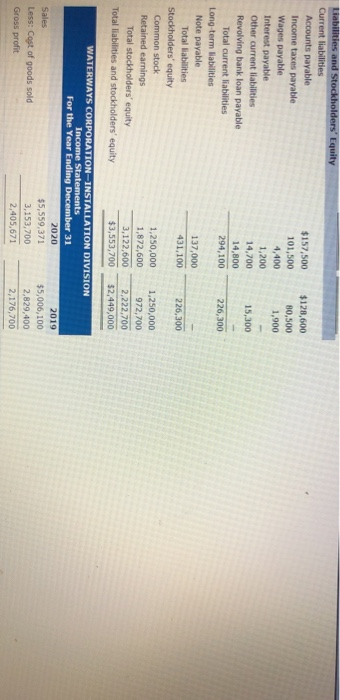
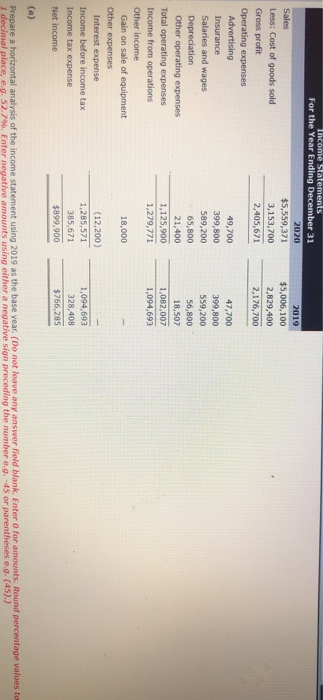
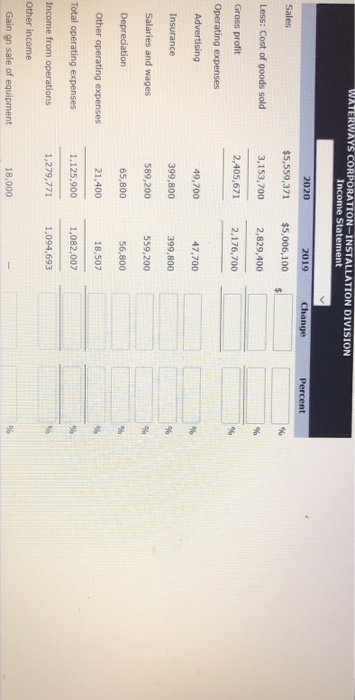
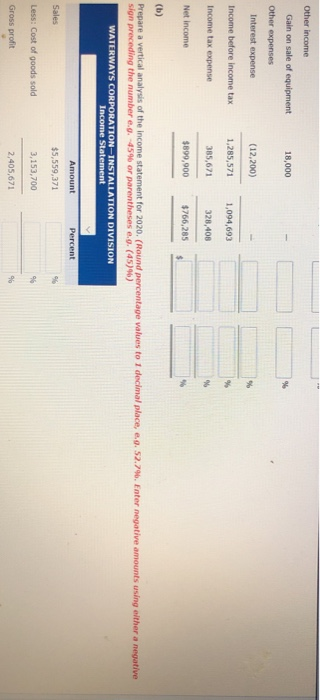
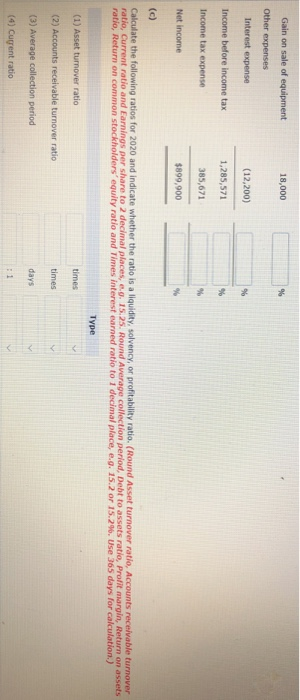
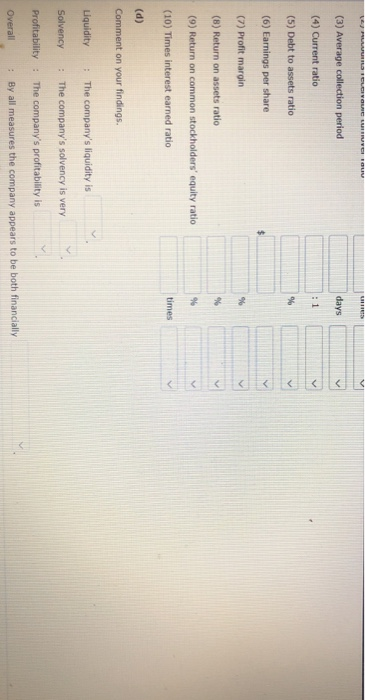
The comparative balance sheets of Waterways Corporation's trrigation Installation Division for the years 2019 and 2020 and the income statements for the year 2019 and 2020 are presented below. Additional information: 85% of the sales for Waterways were credit sales. There are 5,000 shares outstanding for both years. This is a private corporation whose shares are not available to the public. WATERWAYS CORPORATION-INSTALLATION DIVISION Balance Sheets December 31 Assets 2020 2019 Current assets Cash $839,900 $752,800 Accounts receivable 684,400 545,200 Work in process 698,800 Inventory 16,600 7,600 Prepaid expenses 77,300 42,300 Total current assets 2,317,000 1,347,900 Property, plant, and equipment Land 300,000 300,000 Buildings 450,000 450,000 Equipment 925,000 796,700 Furnishings 40,000 40,000 Accumulated depreciation (478,300) (485,600) Total property, plant, and equipment 1,236,700 1,101,100 Total assets $3,553,700 $2,449,000 $128,600 80,500 1,900 Liabilities and Stockholders' Equity Current liabilities Accounts payable Income taxes payable Wages payable Interest payable Other current liabilities Revolving bank loan payable Total current liabilities Long-term liabilities Note payable Total liabilities Stockholders' equity Common stock Retained earnings Total stockholders' equity Total liabilities and stockholders' equity $157,500 101,500 4,400 1,200 14,700 14,800 294,100 15,300 226,300 137,000 431,100 226,300 1,250,000 1,872,600 3,122,600 $3,553,700 1,250,000 972,700 2,222,700 $2,449,000 WATERWAYS CORPORATION INSTALLATION DIVISION Income Statements For the Year Ending December 31 2020 2019 Sales $5,559,371 $5,006,100 Less: Cost of goods sold 3,153,700 2,829,400 Gross profit 2,405,671 2,176,700 2019 $5,006,100 2,829,400 2,176,700 Income Statements For the Year Ending December 31 2020 Sales $5,559,371 Less: Cost of goods sold 3,153,700 Gross profit 2,405,671 Operating expenses Advertising 49,700 Insurance 399,800 Salaries and wages 589,200 Depreciation 65,800 Other operating expenses 21,400 Total operating expenses 1,125,900 Income from operations 1,279,771 Other income Gain on sale of equipment 18,000 Other expenses Interest expense (12,200 Income before income tax 1,285,571 Income tax expense 385,671 Net Income $899.900 47,700 399,800 559,200 56,800 18,507 1,082,007 1,094,693 1,094,693 328,408 $766,285 (a) Prepare a horizontal analysis of the income statement using 2019 as the base year. (Do not leave any answer field blank. Enter o for amounts. Round percentage values to I decimal place, e.g. 52.7 . Enter negative amounts using either a negative sign preceding the number e.g.-5 or parentheses eg. (45) WATERWAYS CORPORATION-INSTALLATION DIVISION Income Statement 2020 Change Percent Sales 2019 $5,006,100 $5,559,371 Less: Cost of goods sold 3,153,700 2,829,400 Gross profit 2,405,671 2,176,700 Operating expenses Advertising 49,700 47,700 Insurance 399,800 399,800 Salaries and wages 589,200 559,200 Depreciation 65,800 56,800 Other operating expenses 21,400 18,507 Total operating expenses 1,125,900 1,082,007 1,279,771 1,094,693 Income from operations Other income Gain on sale of equipment 18,000 Other Income Gain on sale of equipment 18,000 Other expenses Interest expense (12,200) Income before income tax 1,285,571 1,094,693 Income tax expense 385,671 328,408 Net Income $899,900 $766,285 (b) Prepare a vertical analysis of the income statement for 2020. (Round percentage values to 1 decimal place, 6.052.7. Enter negative amo ots using either a negative sign preceding the number e.g. -4596 or parentheses e.. (459) WATERWAYS CORPORATION-INSTALLATION DIVISION Income Statement Percent Amount $5,559,371 Sales Less: Cost of goods sold 3,153,700 Gross profit 2,405,671 Gain on sale of equipment 18,000 Other expenses Interest expense (12,200) Income before income tax 1,285,571 Income tax expense 385,671 Not income $899,900 Calculate the following ratios for 2020 and indicate whether the ratio is a liquidity, solvency, or profitability ratio. (Round Asset turnover ratio, Accounts receivable turnover ratio, Current ratio and Earnings per share to 2 decimal places, u.15.25. Round Average collection period, Debt to assets ratio, Profit margin, Return on assets ratio, Return on common stockholders equity ratio and Times interest earned ratio to 1 decimal place, e.g. 15.2 or 15.29. Use 365 days for calculation. ) (1) Asset turnover ratio (2) Accounts receivable turnover ratio times (3) Average collection period days (4) Current ratio (3) Average collection period (4) Current ratio (5) Debt to assets ratio (6) Earnings per share (7) Profit margin (8) Return on assets ratio (9) Return on common stockholders' equity ratio (10) Times interest earned ratio Comment on your findings. Liquidity : The company's liquidity is Solvency : The company's solvency is very Profitability. The company's profitability is Overall : By all measures the company appears to be both financially