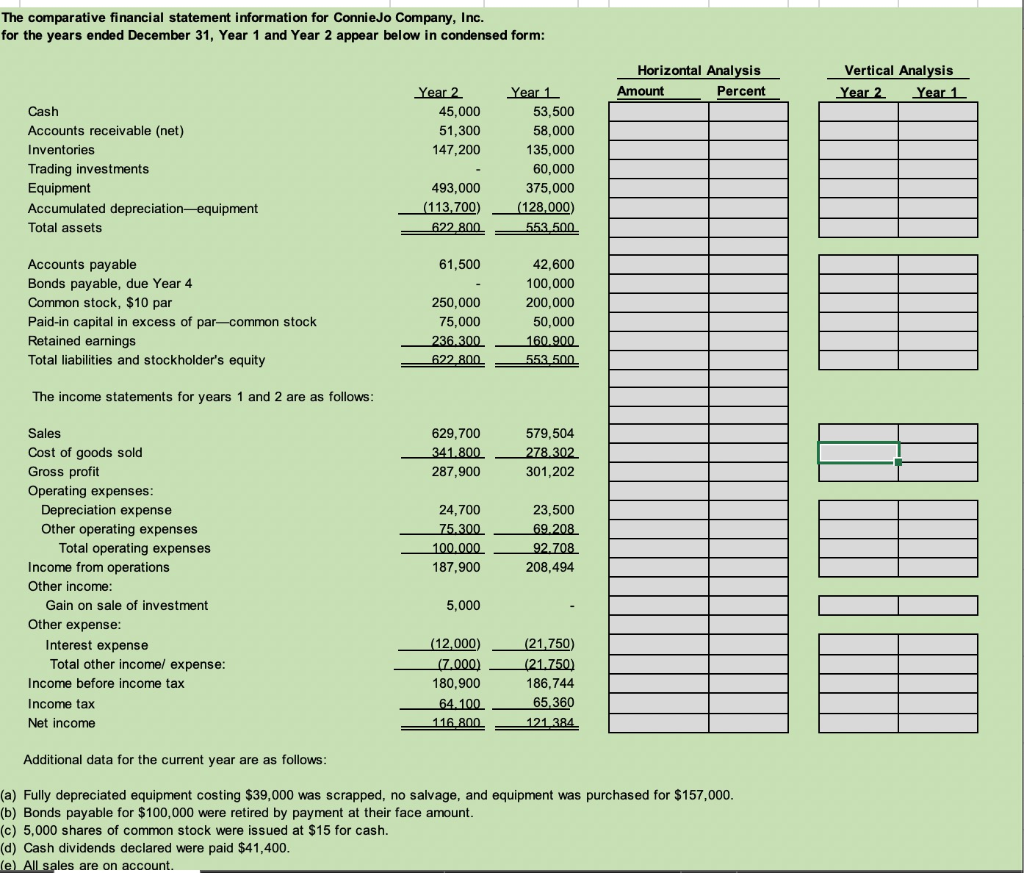
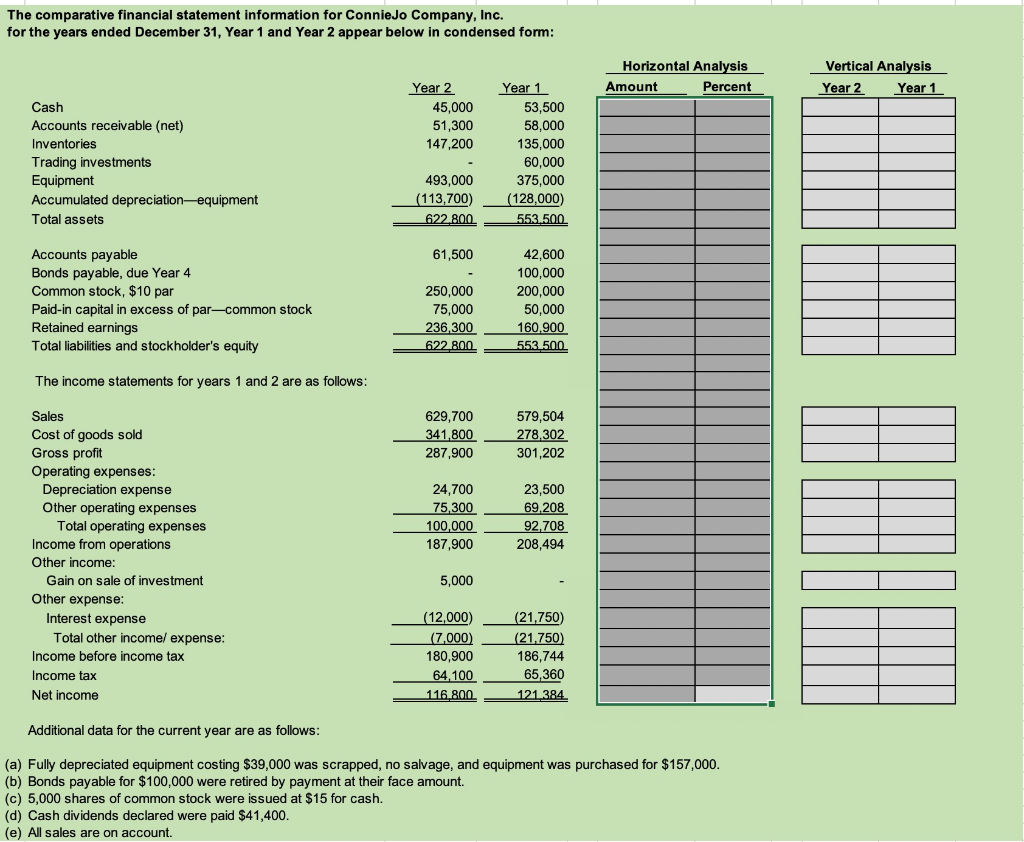
The comparative financial statement information for Connie Jo Company, Inc. for the years ended December 31, Year 1 and Year 2 appear below in condensed form: Horizontal Analysis Amount Percent Vertical Analysis Year 2 Year 1 Year 2 45,000 51,300 147,200 Cash Accounts receivable (net) Inventories Trading investments Equipment Accumulated depreciation-equipment Total assets Year 1 53,500 58,000 135,000 60,000 375,000 (128,000) 553.500 493,000 (113,700) 622 800 61,500 Accounts payable Bonds payable, due Year 4 Common stock, $10 par Paid-in capital in excess of par-common stock Retained earnings Total liabilities and stockholder's equity 250,000 75,000 236.300 622 800 42,600 100,000 200,000 50,000 160.900 553.500. - The income statements for years 1 and 2 are as follows: Sales 629,700 341.800 287,900 579,504 278 302 301,202 T 24,700 75.300 100.000 187,900 23,500 69.208 92.708 208,494 Cost of goods sold Gross profit Operating expenses Depreciation expense Other operating expenses Total operating expenses Income from operations Other income: Gain on sale of investment Other expense: Interest expense Total other incomel expense: Income before income tax Income tax Net income 5,000 (12,000) (7.000) 180,900 64.100 116 800 (21,750) (21.750) 186,744 65,360 121.384 - Additional data for the current year are as follows: (a) Fully depreciated equipment costing $39,000 was scrapped, no salvage, and equipment was purchased for $157,000. (b) Bonds payable for $100,000 were retired by payment at their face amount. (c) 5,000 shares of common stock were issued at $15 for cash. (d) Cash dividends declared were paid $41,400. (e) All sales are on account. The comparative financial statement information for Connie Jo Company, Inc. for the years ended December 31, Year 1 and Year 2 appear below in condensed form: Horizontal Analysis Amount Percent Vertical Analysis Year 2 Year 1 Year 2 45,000 51,300 147,200 Cash Accounts receivable (net) Inventories Trading investments Equipment Accumulated depreciation equipment Total assets Year 1 53,500 58,000 135,000 60,000 375,000 (128,000) 553.500 493,000 (113,700) 622,800 61,500 Accounts payable Bonds payable, due Year 4 Common stock, $10 par Paid-in capital in excess of parcommon stock Retained earnings Total liabilities and stockholder's equity 250,000 75,000 236,300 622 800 42,600 100,000 200,000 50,000 160.900 553.500 The income statements for years 1 and 2 are as follows: 629,700 341,800 287,900 579,504 278,302 301,202 24,700 75,300 100,000 187,900 23,500 69,208 92,708 208,494 Sales Cost of goods sold Gross profit Operating expenses: Depreciation expense Other operating expenses Total operating expenses Income from operations Other income: Gain on sale of investment Other expense: Interest expense Total other income/ expense: Income before income tax Income tax Net income 5,000 (12,000) (7,000) 180,900 64,100 116,800 (21,750) (21,750) 186,744 65,360 121.384 - Additional data for the current year are as follows: (a) Fully depreciated equipment costing $39,000 was scrapped, no salvage, and equipment was purchased for $157,000. (b) Bonds payable for $100,000 were retired by payment at their face amount. (c) 5,000 shares of common stock were issued at $15 for cash. (d) Cash dividends declared were paid $41,400. (e) All sales are on account