Answered step by step
Verified Expert Solution
Question
1 Approved Answer
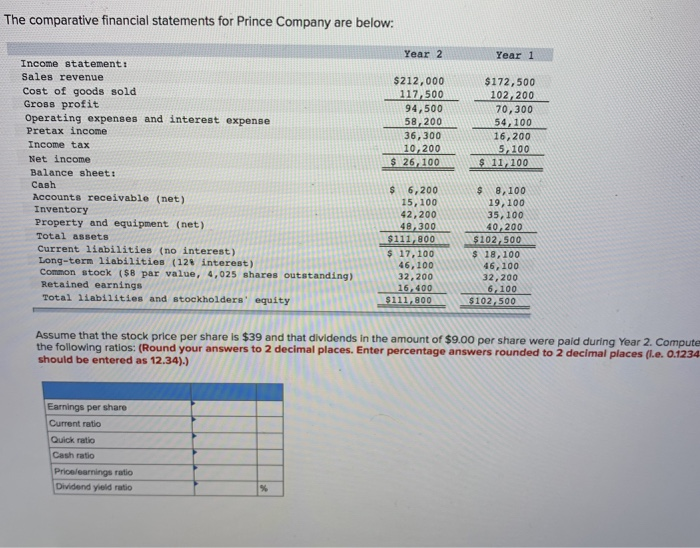
The comparative financial statements for Prince Company are below: Year 2 Year 1 $212,000 117,500 94,500 58,200 36,300 10,200 $ 26, 100 $172,500 102,200 70,300
Step by Step Solution
There are 3 Steps involved in it
Step: 1

Get Instant Access to Expert-Tailored Solutions
See step-by-step solutions with expert insights and AI powered tools for academic success
Step: 2

Step: 3
Ace Your Homework with AI
Get the answers you need in no time with our AI-driven, step-by-step assistance
Get Started