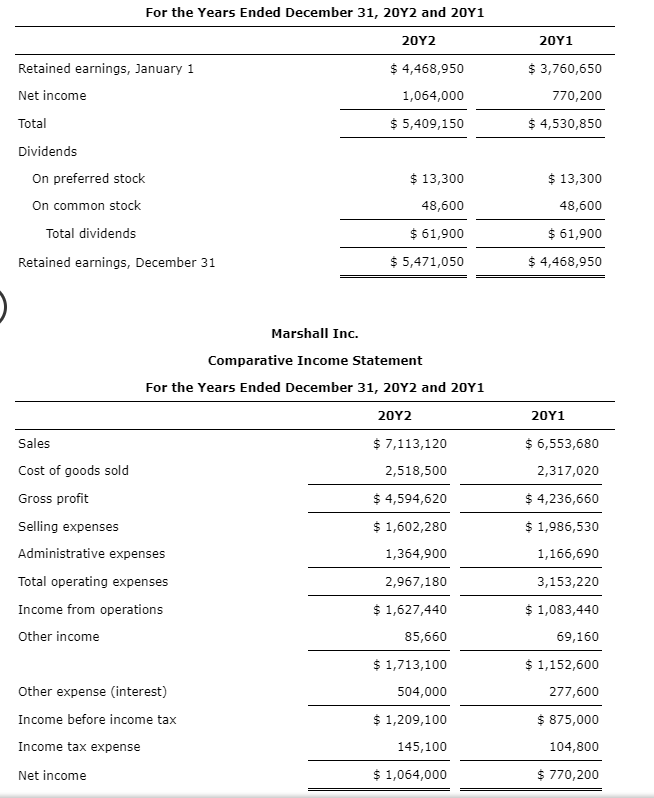
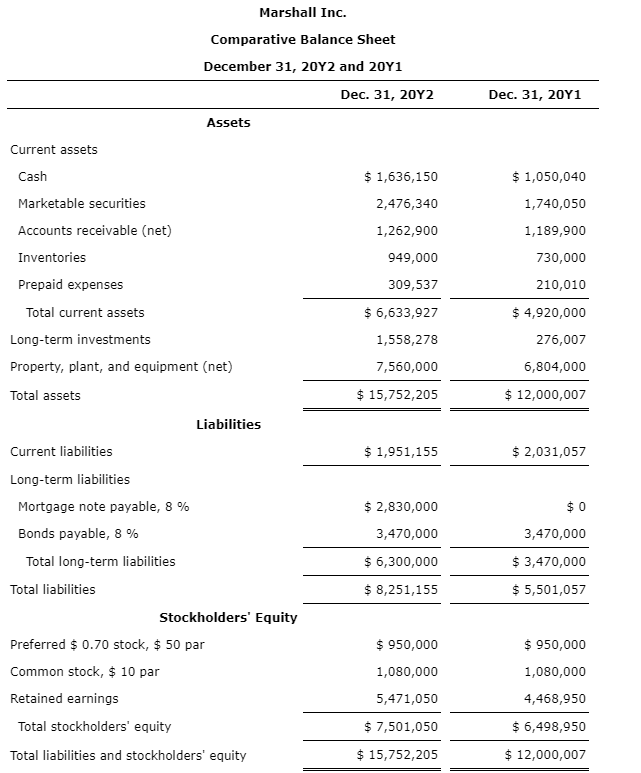
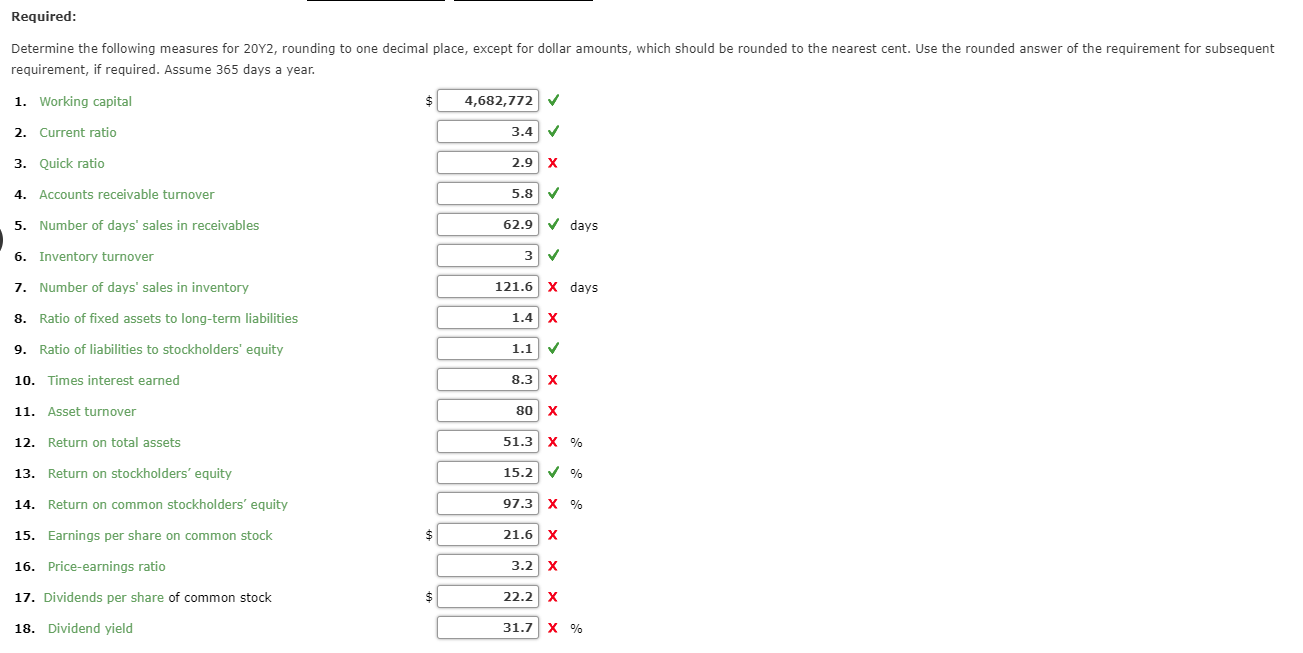
The comparative financial statements of Marshall Inc. are as follows. The market price of Marshall Inc. common stock was $ 70 on December 31, 20Y2 For the Years Ended December 31, 20Y2 and 20Y1 20Y2 20Y1 3,760,650 770,200 $4,530,850 Retained earnings, January 1 Net income Total Dividends $ 4,468,950 1,064,000 5,409,150 13,300 48,600 61,900 $ 4,468,950 On preferred stock On common stock Total dividends $13,300 48,600 $61,900 $ 5,471,050 Retained earnings, December 31 Marshall Inc. Comparative Income Statement For the Years Ended December 31, 20Y2 and 20Y1 20Y2 20Y1 Sales Cost of goods sold Gross profit Selling expenses Administrative expenses Total operating expenses Income from operations Other income 7,113,120 2,518,500 $ 4,594,620 1,602,280 1,364,900 2,967,180 1,627,440 85,660 1,713,100 504,000 1,209,100 145,100 1,064,000 $ 6,553,680 2,317,020 $ 4,236,660 $ 1,986,530 1,166,690 3,153,220 $ 1,083,440 69,160 $ 1,152,600 277,600 875,000 104,800 770,200 Other expense (interest) Income before income tax Income tax expense Net income Marshall Inc. Comparative Balance Sheet December 31, 20Y2 and 20Y1 Dec. 31, 20Y1 Dec. 31, 20Y2 Assets Current assets $ 1,636,150 2,476,340 1,262,900 949,000 309,537 6,633,927 1,558,278 7,560,000 $15,752,205 1,050,040 1,740,050 1,189,900 730,000 210,010 $4,920,000 276,007 6,804,000 $ 12,000,007 Cash Marketable securities Accounts receivable (net) Inventories Prepaid expenses Total current assets Long-term investments Property, plant, and equipment (net) Total assets Liabilities Current liabilities 2,031,057 $ 1,951,155 Long-term liabilities Mortgage note payable, 8 % $2,830,000 3,470,000 6,300,000 $ 8,251,155 $0 3,470,000 $3,470,000 $ 5,501,057 Bonds payable, 8 % Total long-term liabilities Total liabilities Stockholders' Equity Preferred $ 0.70 stock, $ 50 par Common stock, $ 10 par Retained earnings $950,000 1,080,000 5,471,050 $7,501,050 $15,752,205 $950,000 1,080,000 4,468,950 6,498,950 $ 12,000,007 Total stockholders' equity Total liabilities and stockholders' equity Required Determine the following measures for 20Y2, rounding to one decimal place, except for dollar amounts, which should be rounded to the nearest cent. Use the rounded answer of the requirement for subsequent requirement, if required. Assume 365 days a year. 1. Working capital 2. Current ratio 3. Quick ratio 4. Accounts receivable turnover 5. Number of days' sales in receivables 6. Inventory turnover 7. Number of days' sales in inventory 8. Ratio of fixed assets to long-term liabilities 9. Ratio of liabilities to stockholders' equity 10. Times interest earned 11. Asset turnover 12. Return on total assets 13. Return on stockholders equity 14. Return on common stockholders' equity 15. Earnings per share on common stock 16. Price-earnings ratio 17. Dividends per share of common stock 18. Dividend yield $4,682,772V 3.4 2.9 X 5.8 62.9 days 3 121.6 X days 1.4 X 1.1 8.3X 80 X 51.31 x % 15.2 % 97.31 x % 21.6X 3.2 X 22.2X The comparative financial statements of Marshall Inc. are as follows. The market price of Marshall Inc. common stock was $ 70 on December 31, 20Y2 For the Years Ended December 31, 20Y2 and 20Y1 20Y2 20Y1 3,760,650 770,200 $4,530,850 Retained earnings, January 1 Net income Total Dividends $ 4,468,950 1,064,000 5,409,150 13,300 48,600 61,900 $ 4,468,950 On preferred stock On common stock Total dividends $13,300 48,600 $61,900 $ 5,471,050 Retained earnings, December 31 Marshall Inc. Comparative Income Statement For the Years Ended December 31, 20Y2 and 20Y1 20Y2 20Y1 Sales Cost of goods sold Gross profit Selling expenses Administrative expenses Total operating expenses Income from operations Other income 7,113,120 2,518,500 $ 4,594,620 1,602,280 1,364,900 2,967,180 1,627,440 85,660 1,713,100 504,000 1,209,100 145,100 1,064,000 $ 6,553,680 2,317,020 $ 4,236,660 $ 1,986,530 1,166,690 3,153,220 $ 1,083,440 69,160 $ 1,152,600 277,600 875,000 104,800 770,200 Other expense (interest) Income before income tax Income tax expense Net income Marshall Inc. Comparative Balance Sheet December 31, 20Y2 and 20Y1 Dec. 31, 20Y1 Dec. 31, 20Y2 Assets Current assets $ 1,636,150 2,476,340 1,262,900 949,000 309,537 6,633,927 1,558,278 7,560,000 $15,752,205 1,050,040 1,740,050 1,189,900 730,000 210,010 $4,920,000 276,007 6,804,000 $ 12,000,007 Cash Marketable securities Accounts receivable (net) Inventories Prepaid expenses Total current assets Long-term investments Property, plant, and equipment (net) Total assets Liabilities Current liabilities 2,031,057 $ 1,951,155 Long-term liabilities Mortgage note payable, 8 % $2,830,000 3,470,000 6,300,000 $ 8,251,155 $0 3,470,000 $3,470,000 $ 5,501,057 Bonds payable, 8 % Total long-term liabilities Total liabilities Stockholders' Equity Preferred $ 0.70 stock, $ 50 par Common stock, $ 10 par Retained earnings $950,000 1,080,000 5,471,050 $7,501,050 $15,752,205 $950,000 1,080,000 4,468,950 6,498,950 $ 12,000,007 Total stockholders' equity Total liabilities and stockholders' equity Required Determine the following measures for 20Y2, rounding to one decimal place, except for dollar amounts, which should be rounded to the nearest cent. Use the rounded answer of the requirement for subsequent requirement, if required. Assume 365 days a year. 1. Working capital 2. Current ratio 3. Quick ratio 4. Accounts receivable turnover 5. Number of days' sales in receivables 6. Inventory turnover 7. Number of days' sales in inventory 8. Ratio of fixed assets to long-term liabilities 9. Ratio of liabilities to stockholders' equity 10. Times interest earned 11. Asset turnover 12. Return on total assets 13. Return on stockholders equity 14. Return on common stockholders' equity 15. Earnings per share on common stock 16. Price-earnings ratio 17. Dividends per share of common stock 18. Dividend yield $4,682,772V 3.4 2.9 X 5.8 62.9 days 3 121.6 X days 1.4 X 1.1 8.3X 80 X 51.31 x % 15.2 % 97.31 x % 21.6X 3.2 X 22.2X