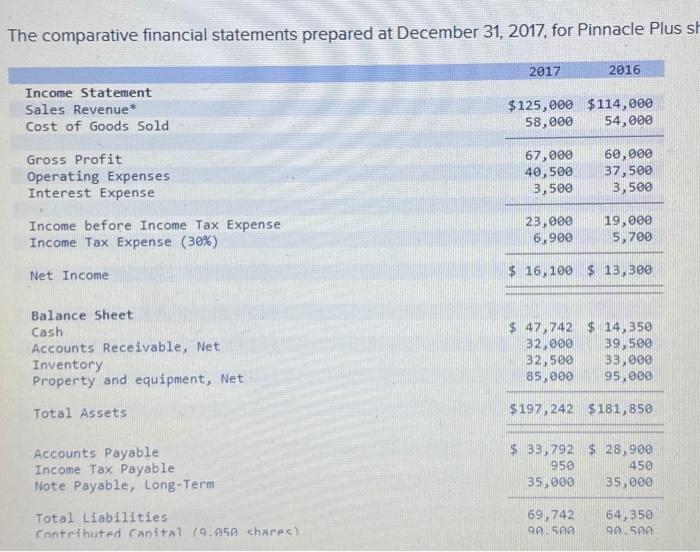
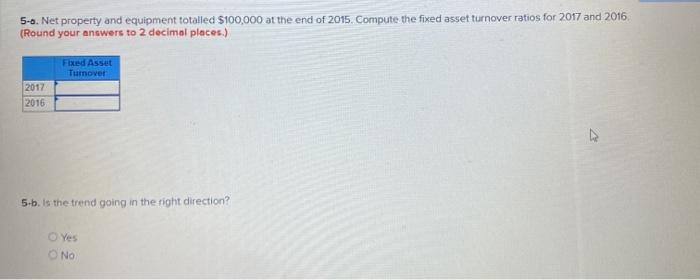
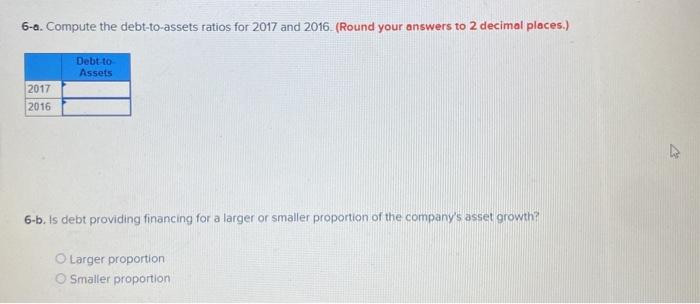
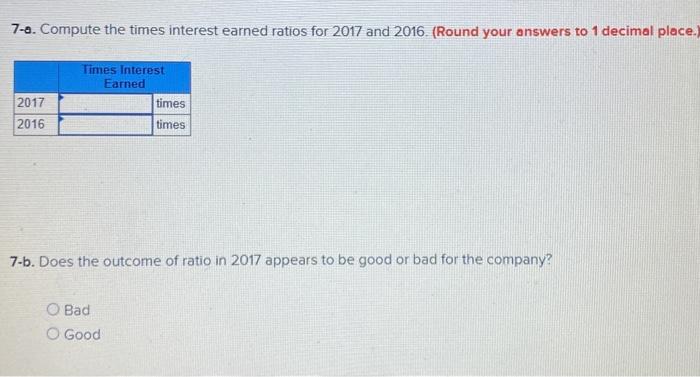
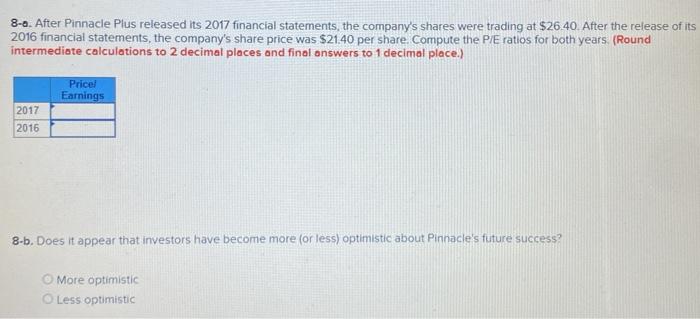
The comparative financial statements prepared at December 31, 2017, for Pinnacle Plus st 2017 2016 Income Statement Sales Revenue Cost of Goods Sold $125,000 $114,000 58,000 54,000 Gross Profit Operating Expenses Interest Expense 67,000 40,500 3,500 60,000 37,500 3,500 Income before Income Tax Expense Income Tax Expense (30%) 23,000 6,900 19,000 5,700 Net Income $ 16,100 $ 13, 300 Balance Sheet Cash Accounts Receivable, Net Inventory Property and equipment, Net $ 47, 742 $ 14,350 32,000 39,500 32,500 33,000 85,000 95,000 Total Assets $ 197, 242 $181,850 Accounts Payable Income Tax Payable Note Payable, Long-Term $ 33,792 $ 28,900 950 450 35,000 35,000 Total Liabilities Contributed Cantal 19.950 chares) 69,742 90.500 64,350 90. Sa 5-a. Net property and equipment totalled $100,000 at the end of 2015. Compute the fixed asset turnover ratios for 2017 and 2016 (Round your answers to 2 decimal places.) Fixed Asset Turnover 2017 2016 5-b. Is the trend going in the right direction? o Yes No 6-a. Compute the debt-to-assets ratios for 2017 and 2016. (Round your answers to 2 decimal places.) Debt to Assets 2017 2016 6-b. Is debt providing financing for a larger or smaller proportion of the company's asset growth Larger proportion Smaller proportion 7-a. Compute the times interest earned ratios for 2017 and 2016. (Round your answers to 1 decimal place. 2017 Times Interest Earned times times 2016 7-5. Does the outcome of ratio in 2017 appears to be good or bad for the company? O Bad O Good 8-0. After Pinnacle Plus released its 2017 financial statements, the company's shares were trading at $26.40. After the release of its 2016 financial statements, the company's share price was $21.40 per share. Compute the P/E ratios for both years. (Round intermediate calculations to 2 decimal places and final answers to 1 decimal place.) Price! Earnings 2017 2016 8-b. Does it appear that investors have become more or less) optimistic about Pinnacle's future success? More optimistic Less optimistic