

Answered step by step
Verified Expert Solution
Question
1 Approved Answer
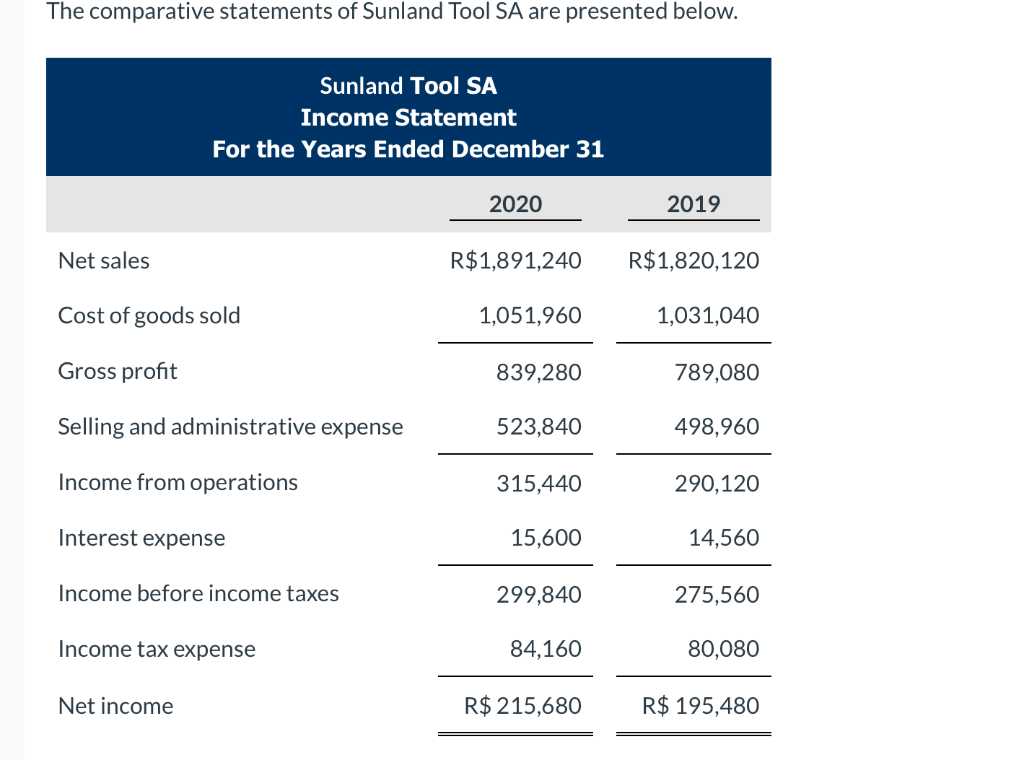
The comparative statements of Sunland Tool SA are presented below. Sunland Tool SA Income Statement For the Years Ended December 31 2020 2019 Net sales
Step by Step Solution
There are 3 Steps involved in it
Step: 1

Get Instant Access to Expert-Tailored Solutions
See step-by-step solutions with expert insights and AI powered tools for academic success
Step: 2

Step: 3
Ace Your Homework with AI
Get the answers you need in no time with our AI-driven, step-by-step assistance
Get Started
Internal Audit Handbook Management With The SAP Audit Roadmap
Authors: Henning Kagermann, William Kinney, Karlheinz Küting, Claus-Peter Weber, Z. Keil, C. Boecker, J. Busch, O. Bussiek, M. H. Christ, P. Eckes, M. Falk, P. S. Greenberg, B. Reichert, M. Wolf
2008th Edition
3642430392, 978-3642430398