

Answered step by step
Verified Expert Solution
Question
1 Approved Answer
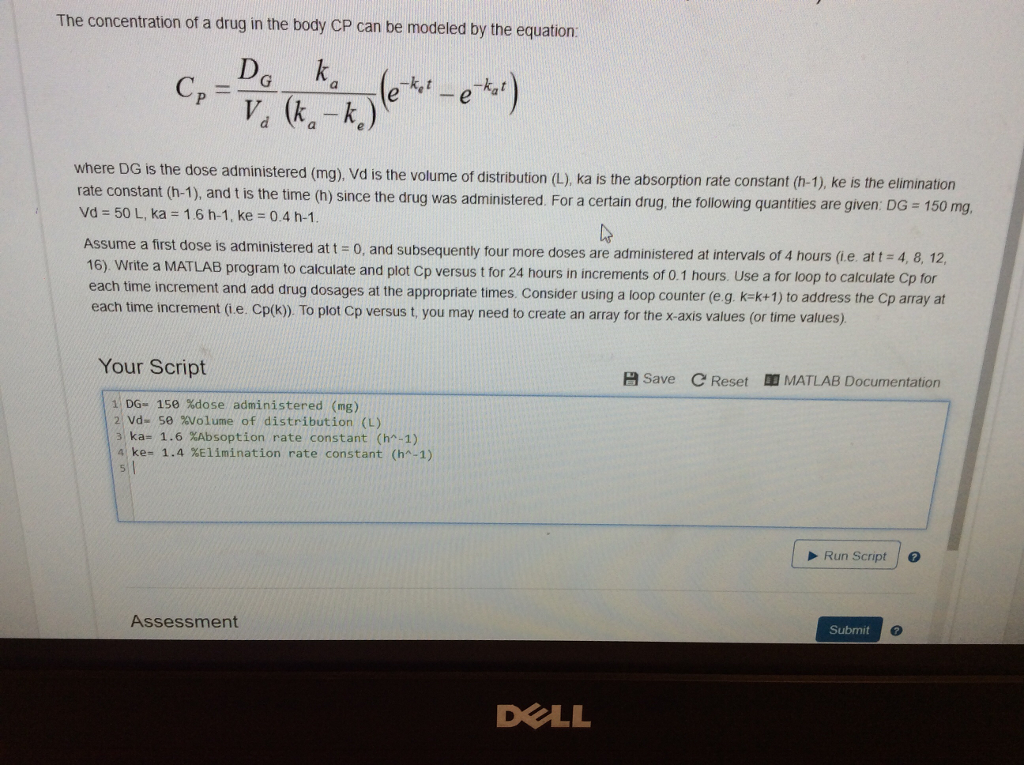
The concentration of a drug in the body CP can be modeled by the equation: Dc V (k-k.) where DG is the dose administered (mg),
Step by Step Solution
There are 3 Steps involved in it
Step: 1

Get Instant Access to Expert-Tailored Solutions
See step-by-step solutions with expert insights and AI powered tools for academic success
Step: 2

Step: 3
Ace Your Homework with AI
Get the answers you need in no time with our AI-driven, step-by-step assistance
Get Started
Intelligent Information And Database Systems Asian Conference Aciids 2012 Kaohsiung Taiwan March 2012 Proceedings Part 2 Lnai 7197
Authors: Jeng-Shyang Pan ,Shyi-Ming Chen ,Ngoc-Thanh Nguyen
2012th Edition
3642284892, 978-3642284892