Answered step by step
Verified Expert Solution
Question
1 Approved Answer
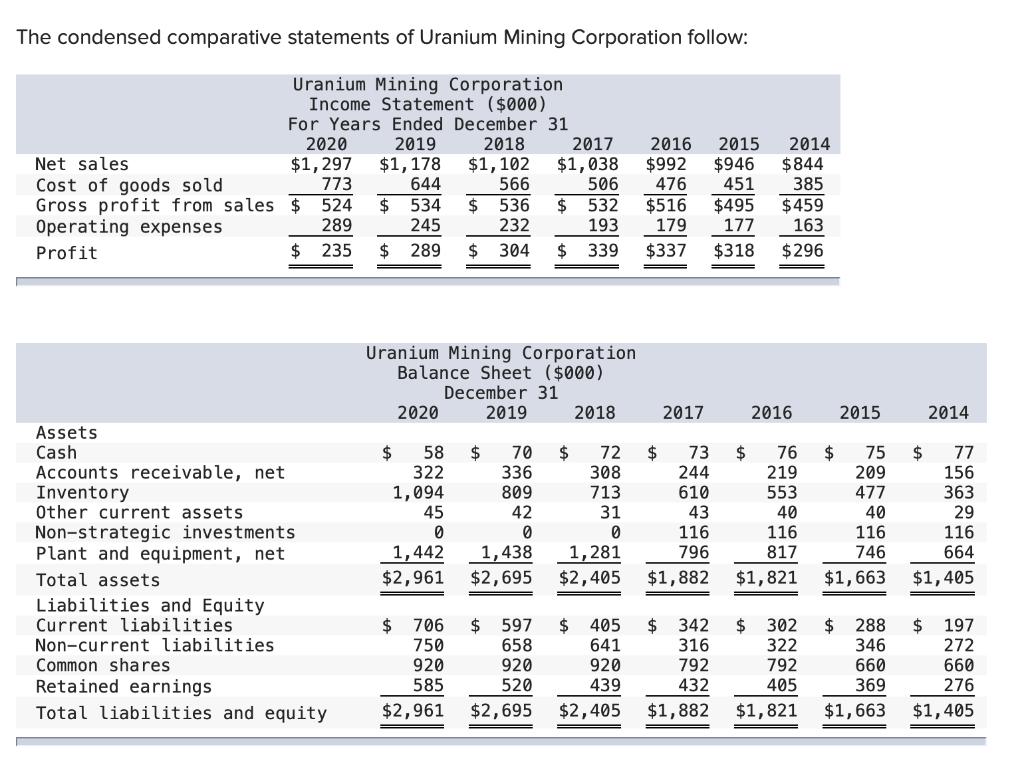
The condensed comparative statements of Uranium Mining Corporation follow: Assets Cash 2019 Uranium Mining Corporation Income Statement ($000) For Years Ended December 31 2018


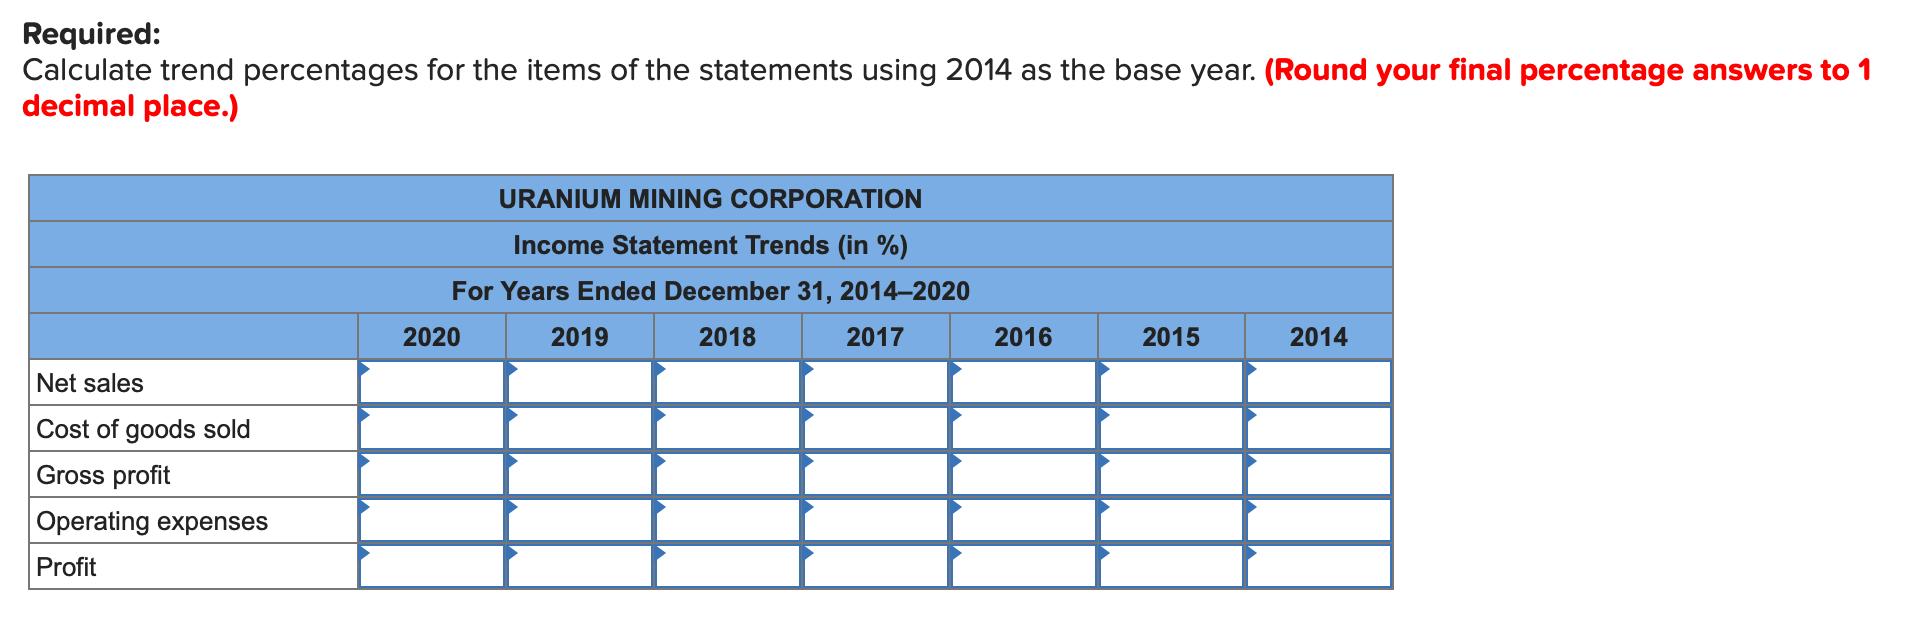
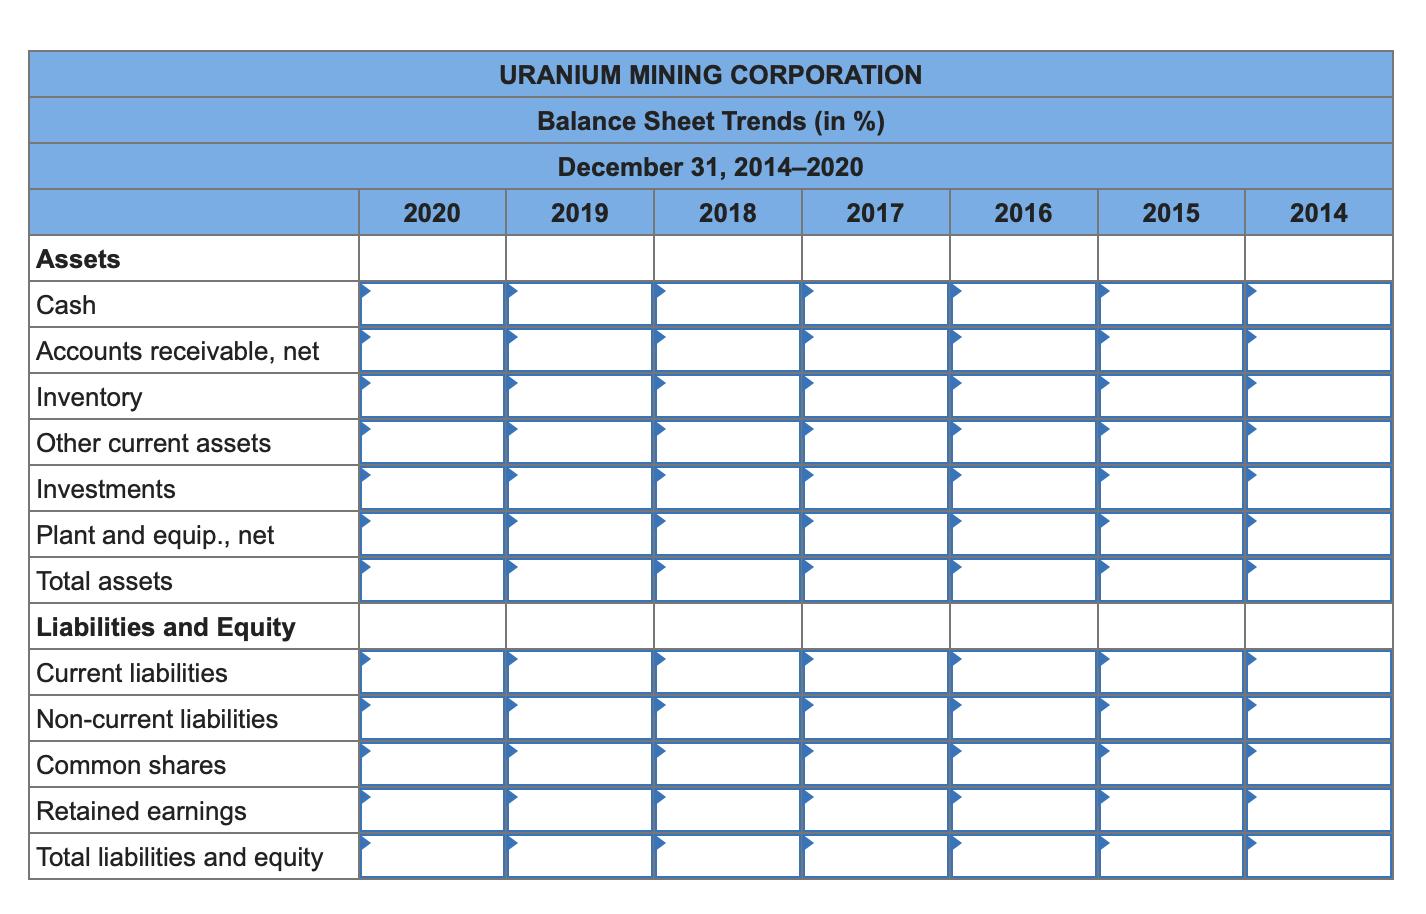
The condensed comparative statements of Uranium Mining Corporation follow: Assets Cash 2019 Uranium Mining Corporation Income Statement ($000) For Years Ended December 31 2018 2017 2016 2015 2014 $1,102 $1,038 $992 $946 $844 566 506 476 451 536 $ 532 $516 232 193 $1,178 644 385 $ 534 $ 245 179 $ 289 $ 304 $ 339 $337 Net sales 773 Cost of goods sold Gross profit from sales $ 524 Operating expenses 289 Profit $ 235 2020 $1,297 Liabilities and Equity Current liabilities Non-current liabilities Accounts receivable, net Inventory Other current assets Non-strategic investments Plant and equipment, net Total assets Common shares Retained earnings Total liabilities and equity Uranium Mining Corporation Balance Sheet ($000) December 31 2019 $ 2020 58 $ 322 1,094 45 0 1,442 $2,961 $ 70 336 809 42 0 1,438 $2,695 $ 658 920 520 $2,695 2018 72 308 713 31 0 706 $ 597 $ 405 750 641 920 920 585 439 $2,961 $2,405 $ 2017 73 244 610 43 116 796 1,281 $2,405 $1,882 $ 342 316 792 432 $1,882 $495 $459 177 163 $318 $296 $ +A 2016 76 $ 75 219 209 477 553 40 116 817 $1,821 2015 $ 302 322 792 405 $1,821 40 116 746 $1,663 $ 288 346 660 369 $1,663 LA 2014 77 156 363 29 116 664 $1,405 $ 197 272 660 276 $1,405 Required: Calculate trend percentages for the items of the statements using 2014 as the base year. (Round your final percentage answers to 1 decimal place.) Net sales Cost of goods sold Gross profit Operating expenses Profit URANIUM MINING CORPORATION Income Statement Trends (in %) For Years Ended December 31, 2014-2020 2018 2017 2020 2019 2016 2015 2014 Assets Cash Accounts receivable, net Inventory Other current assets Investments Plant and equip., net Total assets Liabilities and Equity Current liabilities Non-current liabilities Common shares Retained earnings Total liabilities and equity 2020 URANIUM MINING CORPORATION Balance Sheet Trends (in %) December 31, 2014-2020 2018 2019 2017 2016 2015 2014
Step by Step Solution
★★★★★
3.38 Rating (157 Votes )
There are 3 Steps involved in it
Step: 1
Net Sales Cost of goods sold Gross Profit Operating expenses Profit 2020 1537 2008 114...
Get Instant Access to Expert-Tailored Solutions
See step-by-step solutions with expert insights and AI powered tools for academic success
Step: 2

Step: 3

Ace Your Homework with AI
Get the answers you need in no time with our AI-driven, step-by-step assistance
Get Started


